What's New?
WEB: March/2025
Updated at 3/6/2025
The new update of the DynaPredict Web Platform is now available! 🌐
The platform brings updates related to Smart Spot Configuration, Associated Spot Status, and Alert Omission in Metric Graphs:
🆕 Smart Spot Configuration
Aiming for even more practical solutions in platform usability, the new update brings improvements to the Standard Spectral configuration of DynaLoggers, enhancing the parameterization of Spots. 🚀
Now, Spot configuration will be carried out based on artificial intelligence analysis! ✨
This new feature will be integrated into Bulk Spot Configuration, allowing for the quick application of settings to a large number of DynaLoggers. 🎯
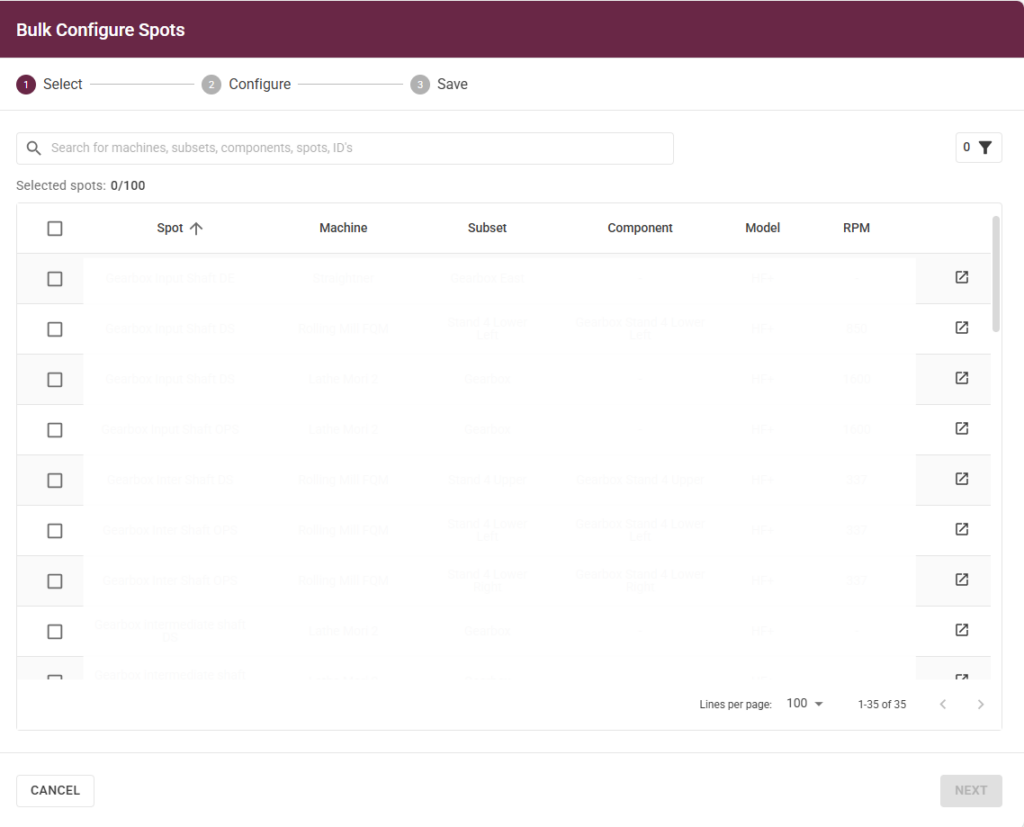
📌 To use this tool, go to “Bulk Spot Configuration” available on the Spots and Monitoring Management screens. There, select the Spots whose DynaLoggers you want to configure and click “Next.”

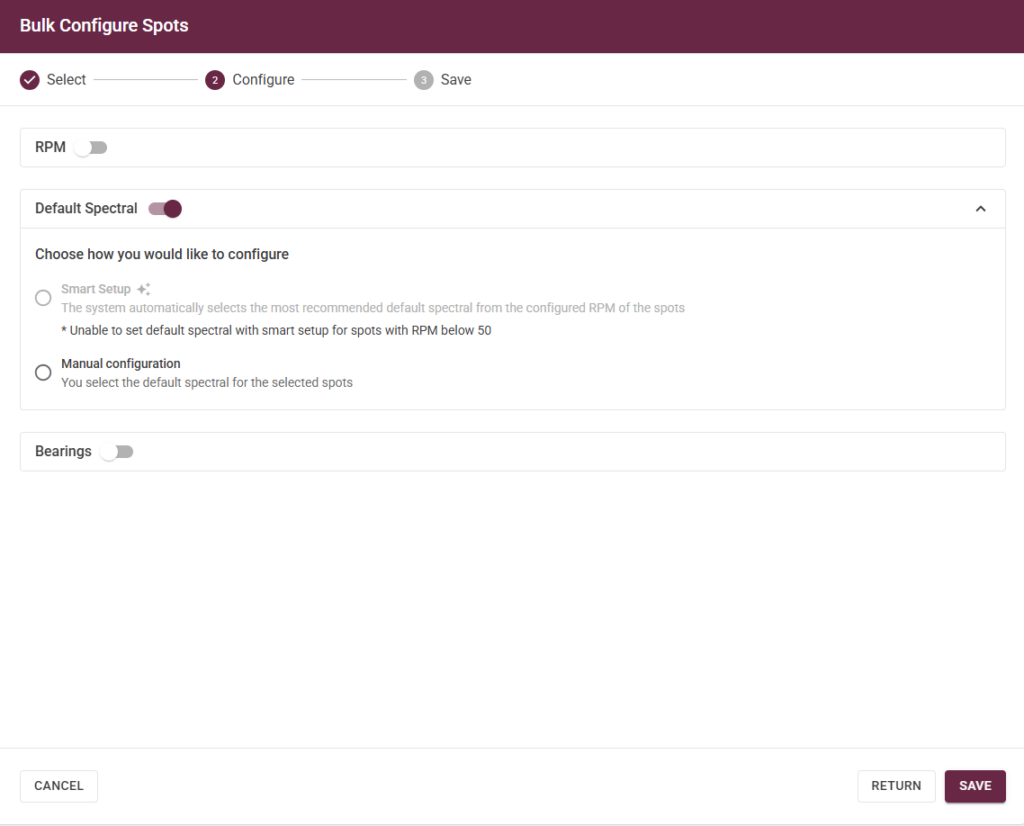
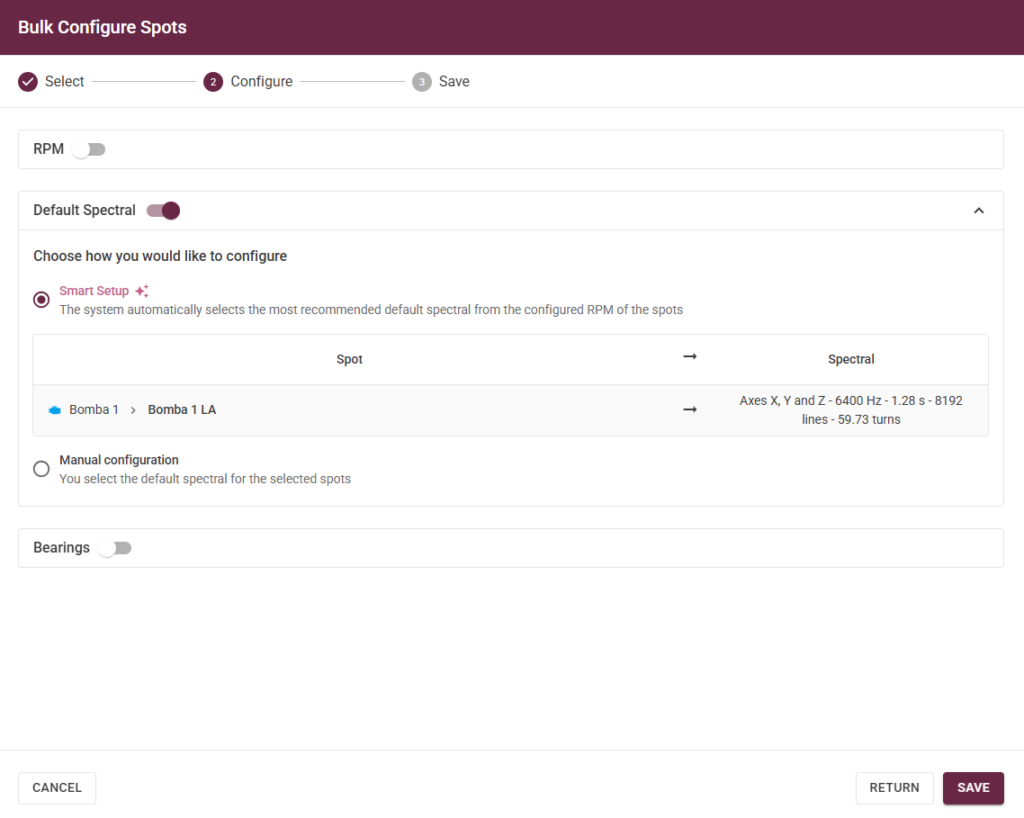
In the next step, enable the Standard Spectral configuration and select the Smart Configuration option.

A preview of the selected configurations for each Spot is displayed, including the maximum frequency, collection duration, resolution in number of lines, and the number of measured rotations, calculated based on the RPM provided in the Spot and the collection duration.

Finally, just click Save!
💡 Additionally, here are some important details about this new update:
The Standard Spectral Configuration is determined based on three key factors:
✅ Spot RPM
✅ DynaLogger Model
It is still possible to manually select the Standard Spectral Configuration, but only for DynaLoggers of the same model.
🆕 Status of Associated Spots
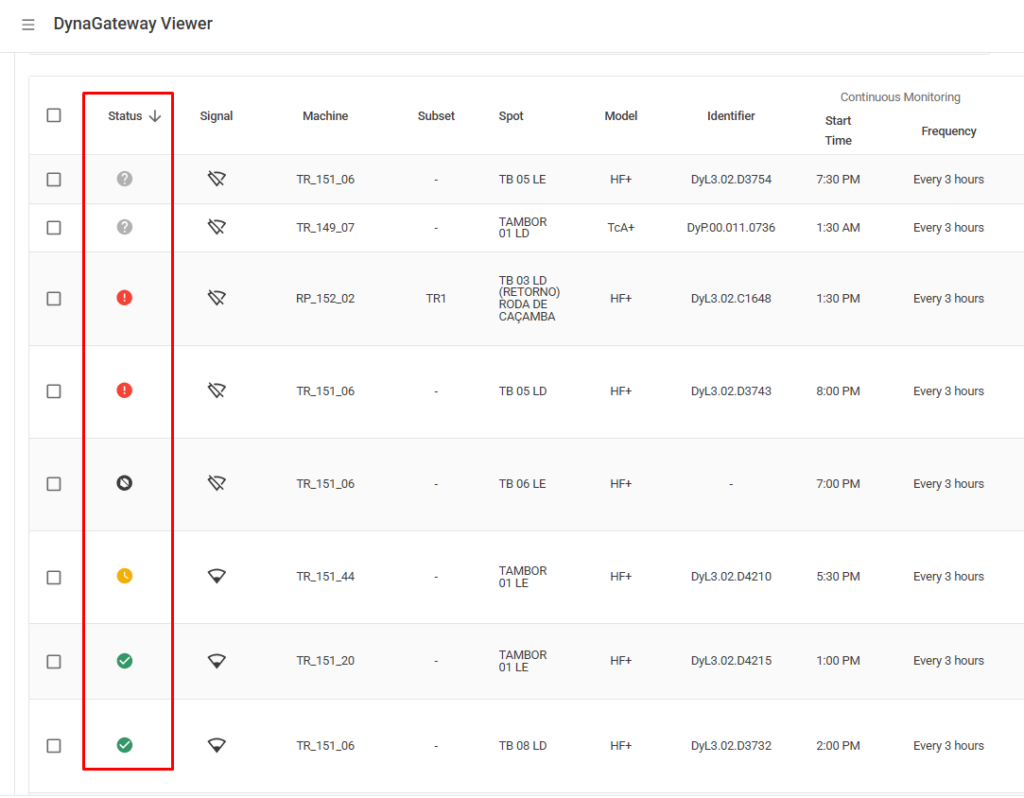
This update also brings improvements to the Status of Associated Spots on the DynaGateway Viewer screen. Now, you can check the status of each Spot in greater detail, with expanded status options, allowing for five (5) possible modes:
🟩Successfully Collected (Green): The DynaGateway successfully collected sensor telemetry at the defined frequency.
🟨Collection Delay (Yellow): The DynaGateway failed to collect telemetry successfully, and at least one telemetry collection is delayed.
🟥Connection Issue (Red): The DynaGateway failed to collect telemetry, and more than three telemetry periods were missed by the sensor.
⬛Not Sensorized (Black): There is no sensor associated with the Spot.
⚪Unknown Status (Gray): There is no information about the sensor because it has not been collected by the associated DynaGateway.

🆕Omission of Alerts in Metric Charts
More platform updates! To enhance usability, a new option is now available, allowing you to view configured alerts directly in the charts.
This new feature enables you to select a single alert per axis, providing a clearer visualization of uniaxial alerts in the charts. The option can be found just below the metric name.
📌 How to use it?
Simply select the alert for the desired axis (e.g., X-Axis – Horizontal) and then enable the display of only that axis below the chart.


Enjoy the new update, now available on the Web Platform! 🚀
Back to articles

