What's New?
WEB: December/2024
Updated at 12/12/2024
The new version of the DynaPredict Web Platform is now available. Check out the main functionalities you can explore.
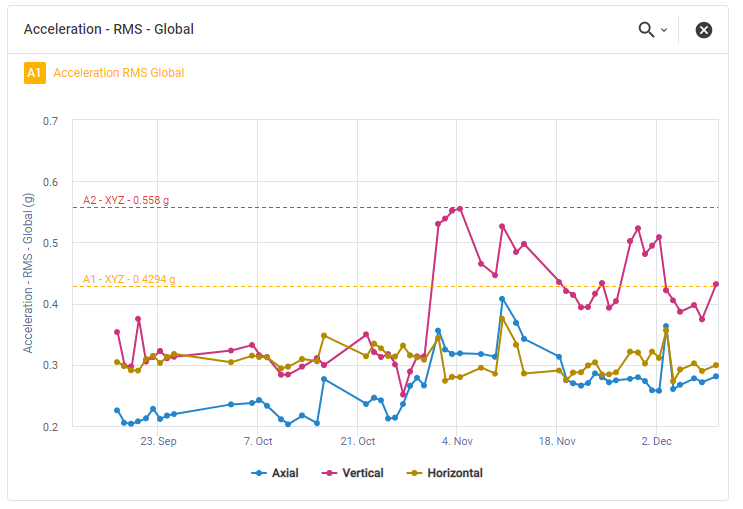
🌟 Visualization of Alerts on Charts
You can now easily visualize the alert levels directly on the graphs. This new feature guarantees an even more intuitive and optimized experience for monitoring your assets.

This new visualization allows you to identify the current status of alerts directly in the graphical interface. If there are multiple alerts configured for a metric, the platform will always highlight the most critical alerts first when analysing them.
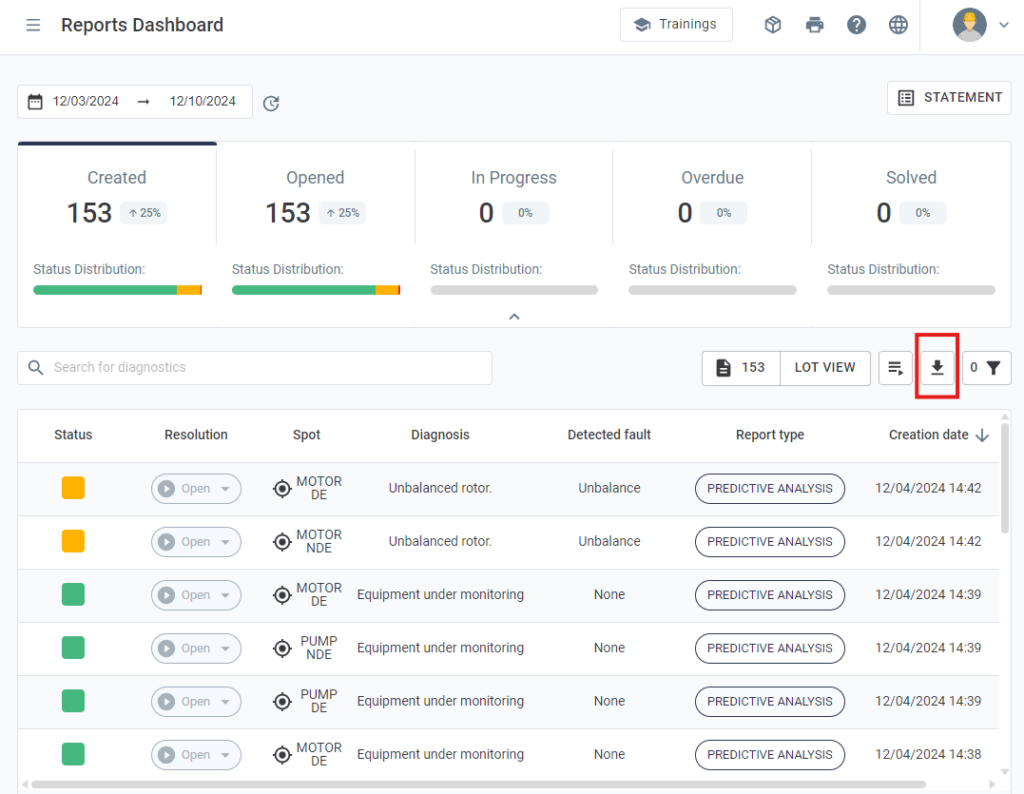
📄 Export reports in .CSV
Export the complete data of your reports directly from the dashboard screen:

With this new feature, you can export information such as status, diagnosis, recommended actions and much more to .CSV format.
Make it easier to access and analyse your reports in a more practical and personalized way!
Back to articles

