Web Platform
9) Accessing the Vibration Spectral Screen
Updated at 3/7/2023
Vibration Spectra is useful for failure mode analysis in industrial machinery. Through them, it is possible to identify what type of defect is evolving or appearing in the asset, in order to schedule maintenance and avoid corrective stops in the production line.
Access to the spectral analysis screen occurs in several ways within the Web Platform. Below are presented the main ones:
1) Through the timeline of each Spot or machine
The spectra are accessible via the spectral analysis icon “![]() ” on the timeline in the data history screen, avaiable in the Machine Viewer and Spot Viewer screens. When you select the icon, a summary window with details of the spectra will be displayed. In the summary window you can access general information, a simplified version of the graph, and insert or view any comments entered by users.
” on the timeline in the data history screen, avaiable in the Machine Viewer and Spot Viewer screens. When you select the icon, a summary window with details of the spectra will be displayed. In the summary window you can access general information, a simplified version of the graph, and insert or view any comments entered by users.
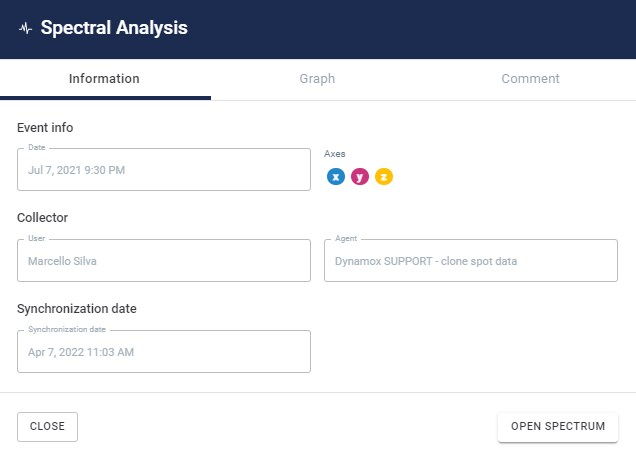
Figure: Event Report – Spectral Analysis
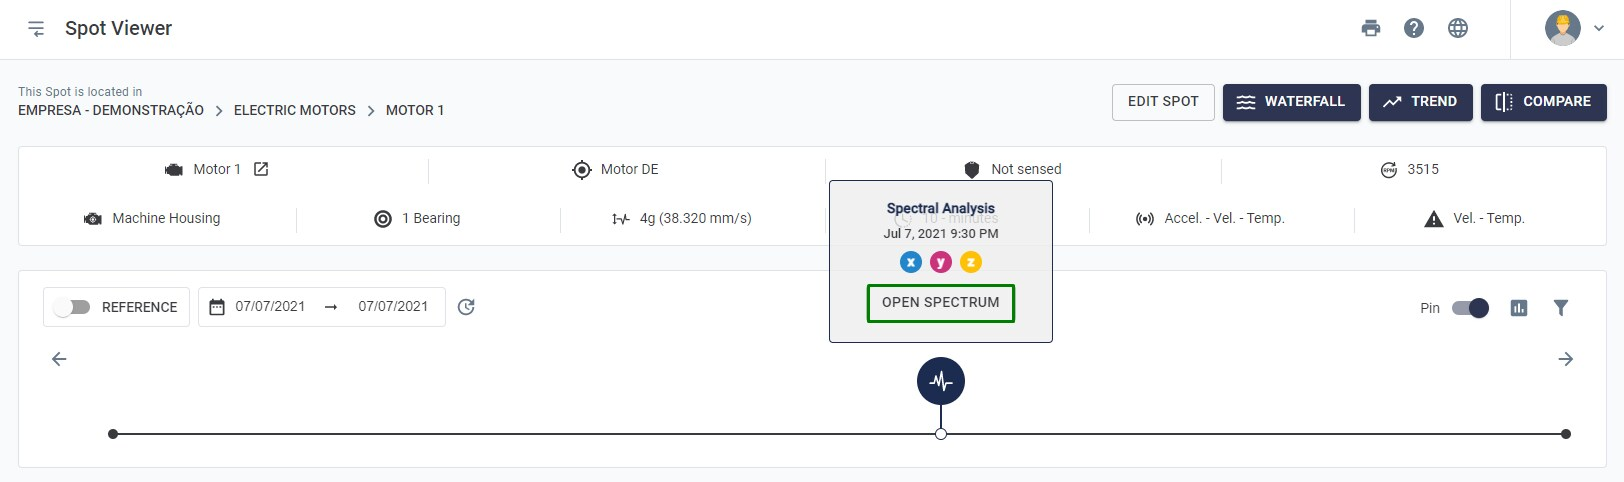
The complete chart, with all the tools, can be accessed by clicking on the “Open Graph” button on the screen above or directly on the icon, as shown below:
2) Access via spectral trend
This is done by clicking on the Spectral Trend graph point. As discussed in this link, each point of the spectral trend represents a spectrum, with its respective date and time of acquisition. When selecting one of the points on the graph, the respective spectrum is opened on a new screen.
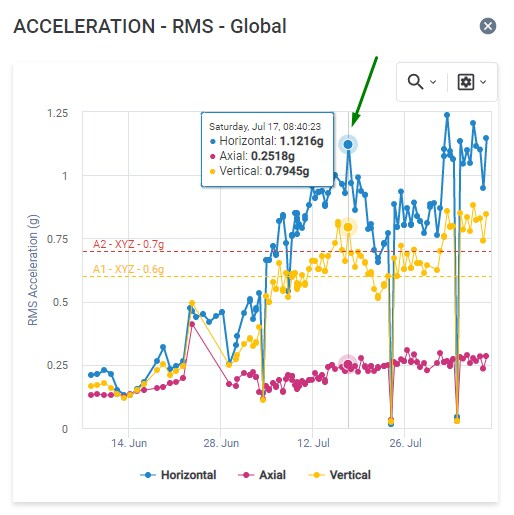
Figure: Spectral Trend – accessing the spectral at a desired point
3) Through the “Spectral Analysis” screen in the side menu
The user can access a list of all spectra performed in the sector or site to which he is logged in through “Spectral Analysis” in the side menu.
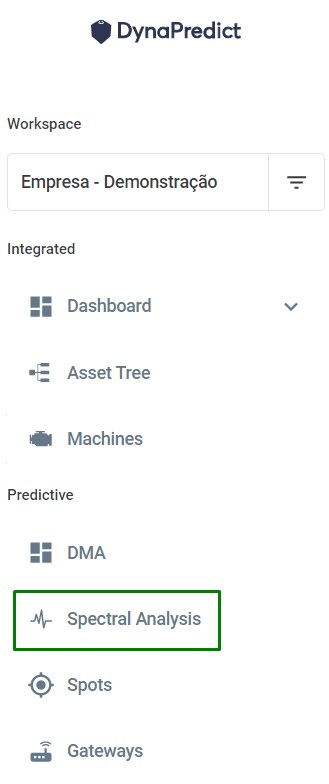
Figure: Spectral Analysis option in the side menu
When accessing this screen, the user can filter by various items, such as machine, Spot, or serial number of a DynaLogger.
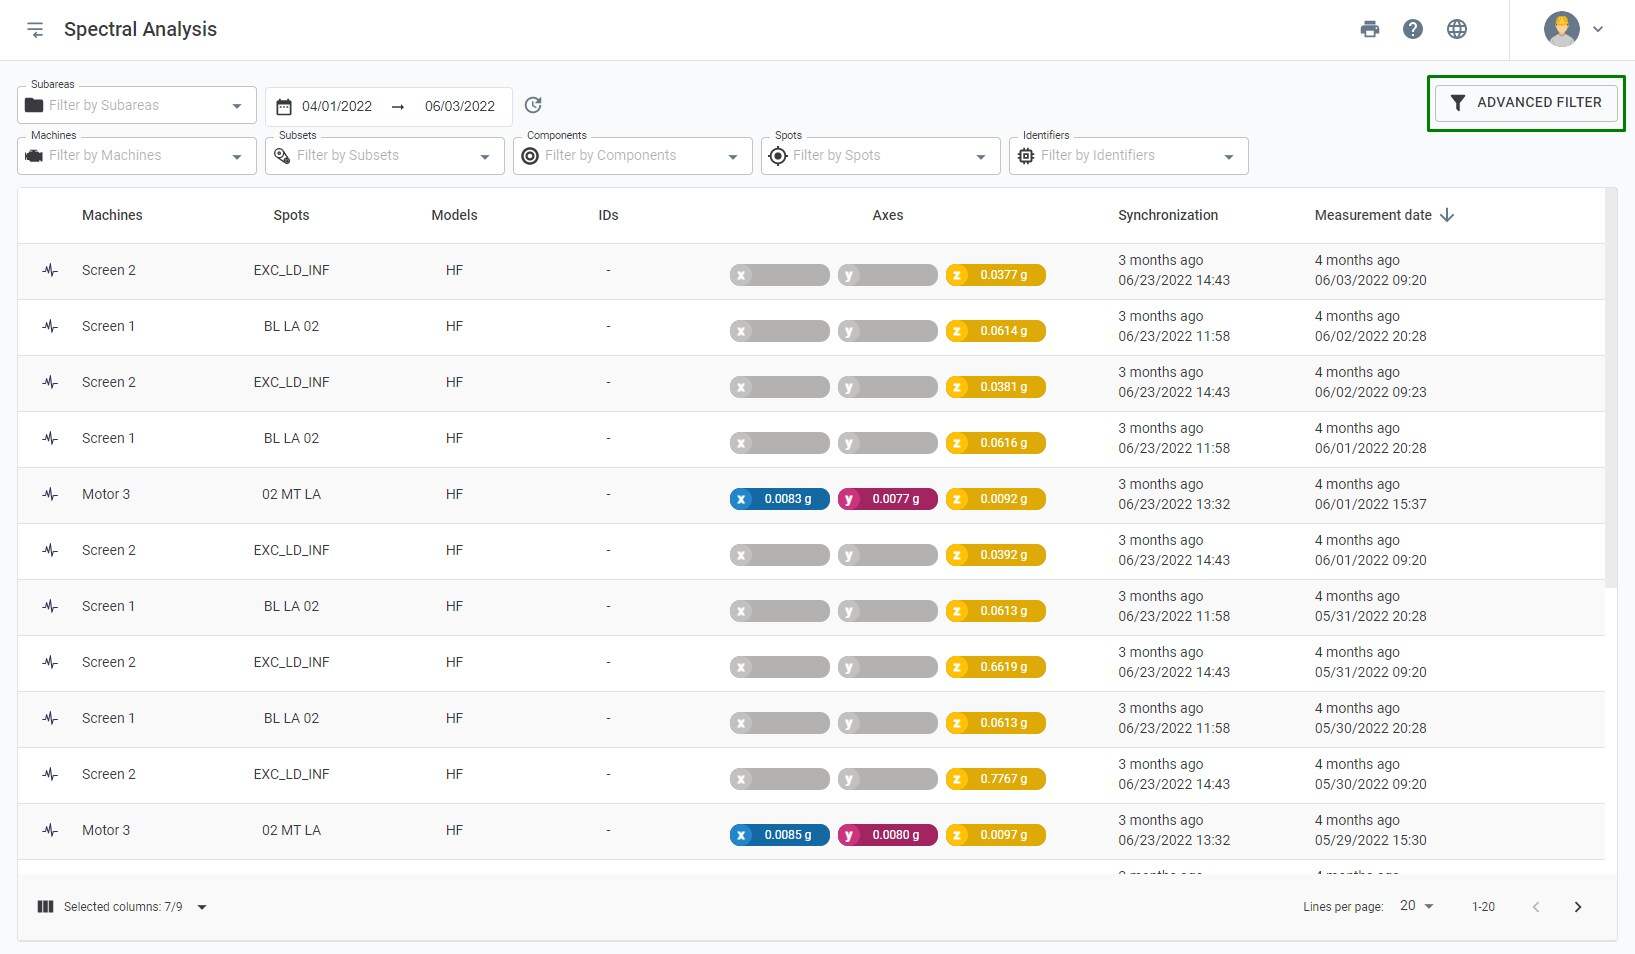
Figure: Spectral list with selectable filters
When using any of the three ways mentioned above, the spectral screen will open, displaying the spectrum in the frequency domain and the waveform in the time domain. The screens and functionality of the spectral analysis will be detailed in subsequent sections.
Back to articles