Web Platform
9.6) Spectral Waterfall
Updated at 3/6/2023
The waterfall is a three-dimensional graph where up to 10 spectra of a monitoring point are displayed, helping the analyst to identify fault trends from the growth of vibration amplitudes.
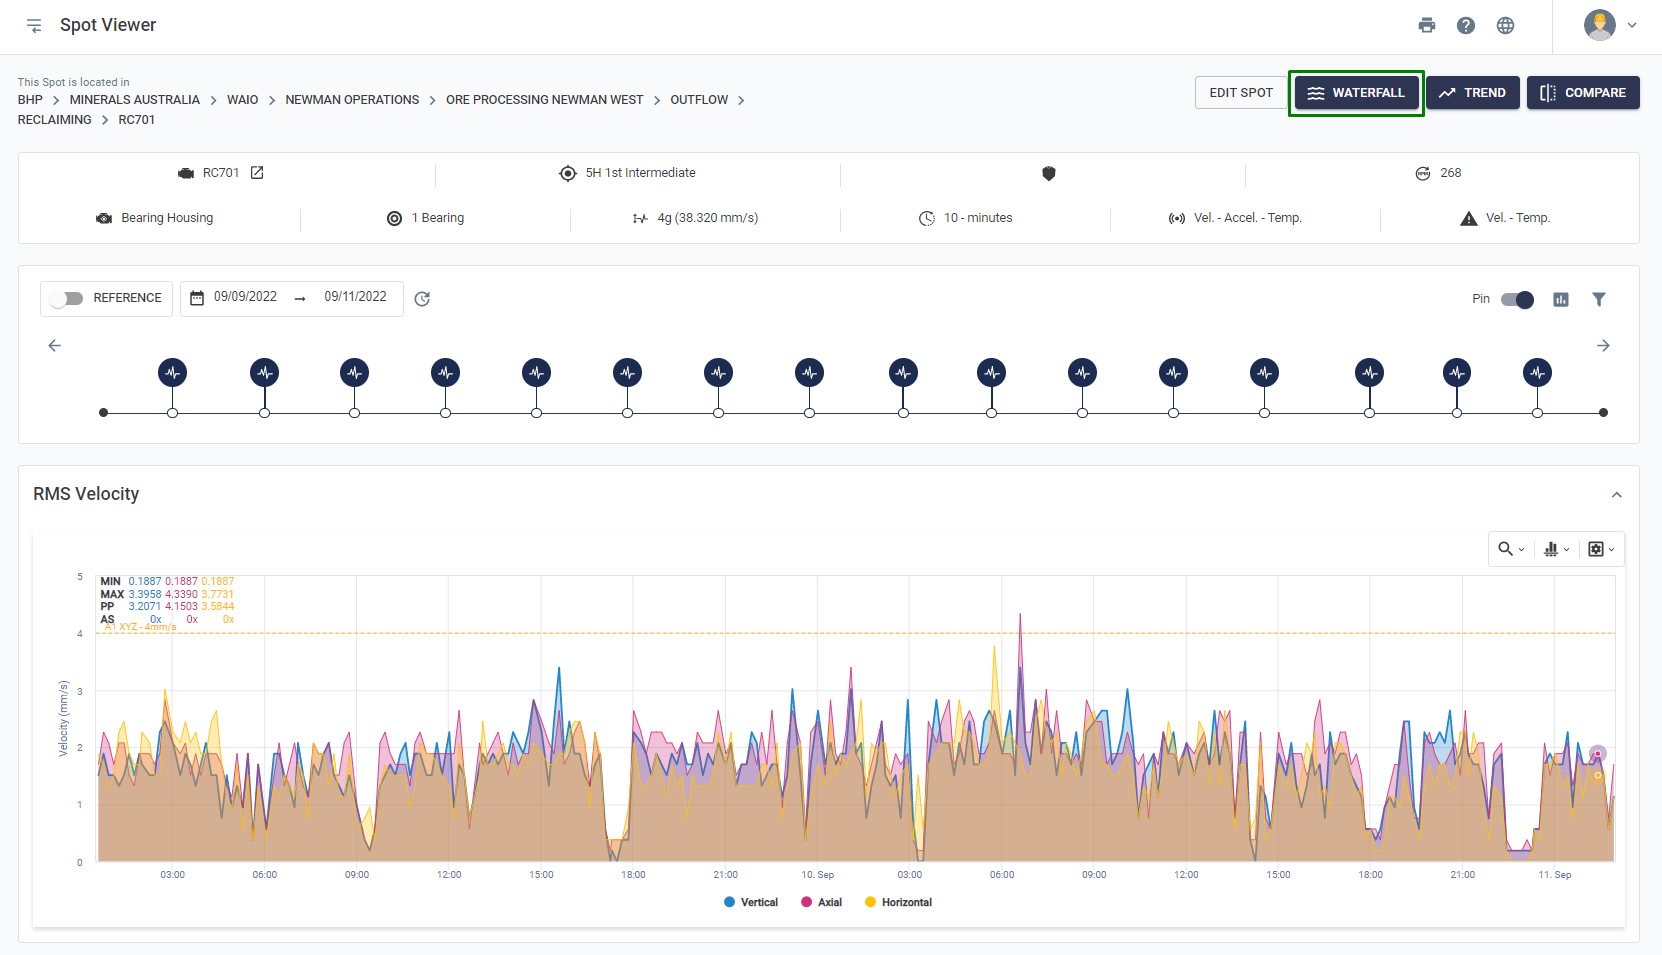
It can be accessed via the Cascade button present at the top of the “Spot Viewer” and “Spectral” pages.
In the window that will be displayed, you must select which spectra will be used to form the cascade. The available filters are: date of spectra, settings (it is necessary that all spectra have the same frequency settings, monitored axes and duration) and acceleration threshold. The acceleration threshold filters spectra whose RMS acceleration is below a user-defined value, in order to only use graphs generated while the machine is running.
With the filters set, simply select the spectra to be used by clicking on the “![]() ” ssymbol to the right of each spectrum listed at the bottom of the window and then clicking “
” ssymbol to the right of each spectrum listed at the bottom of the window and then clicking “![]() “.
“.
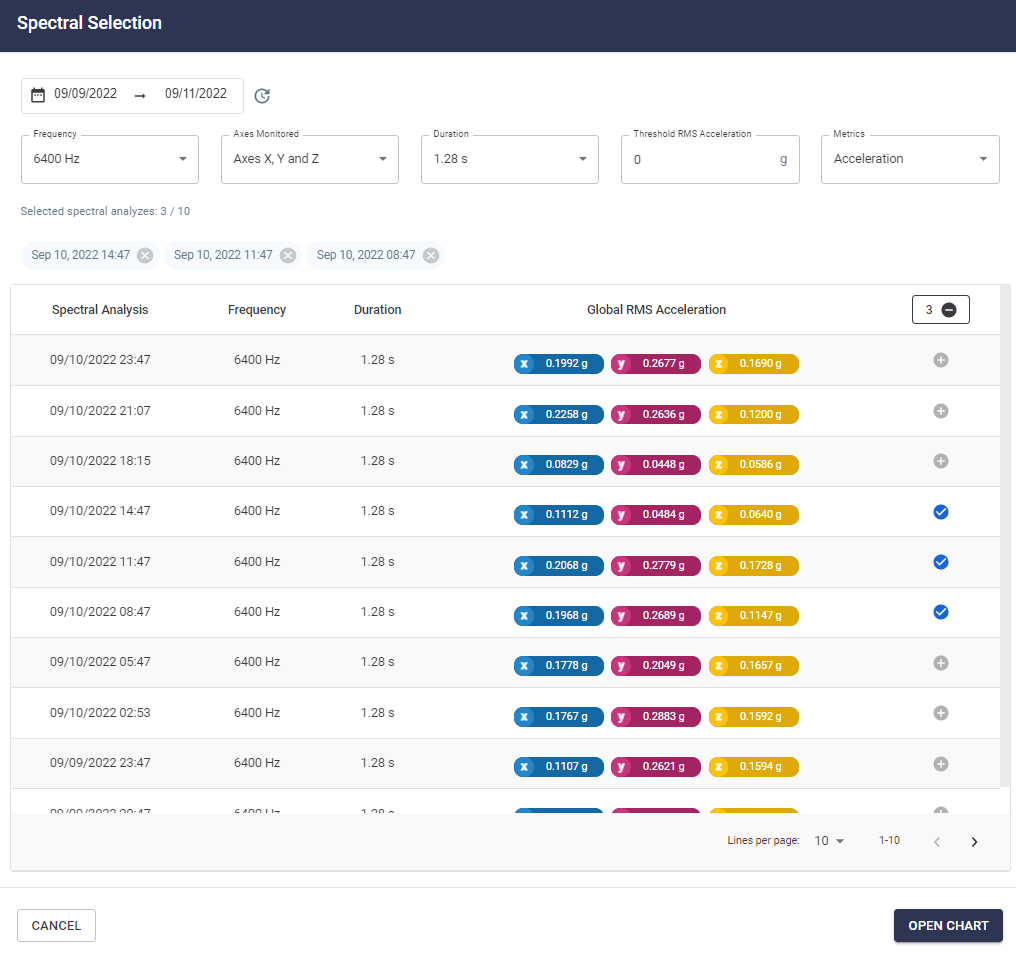
Figure: Selection of Spectra to build the waterfall
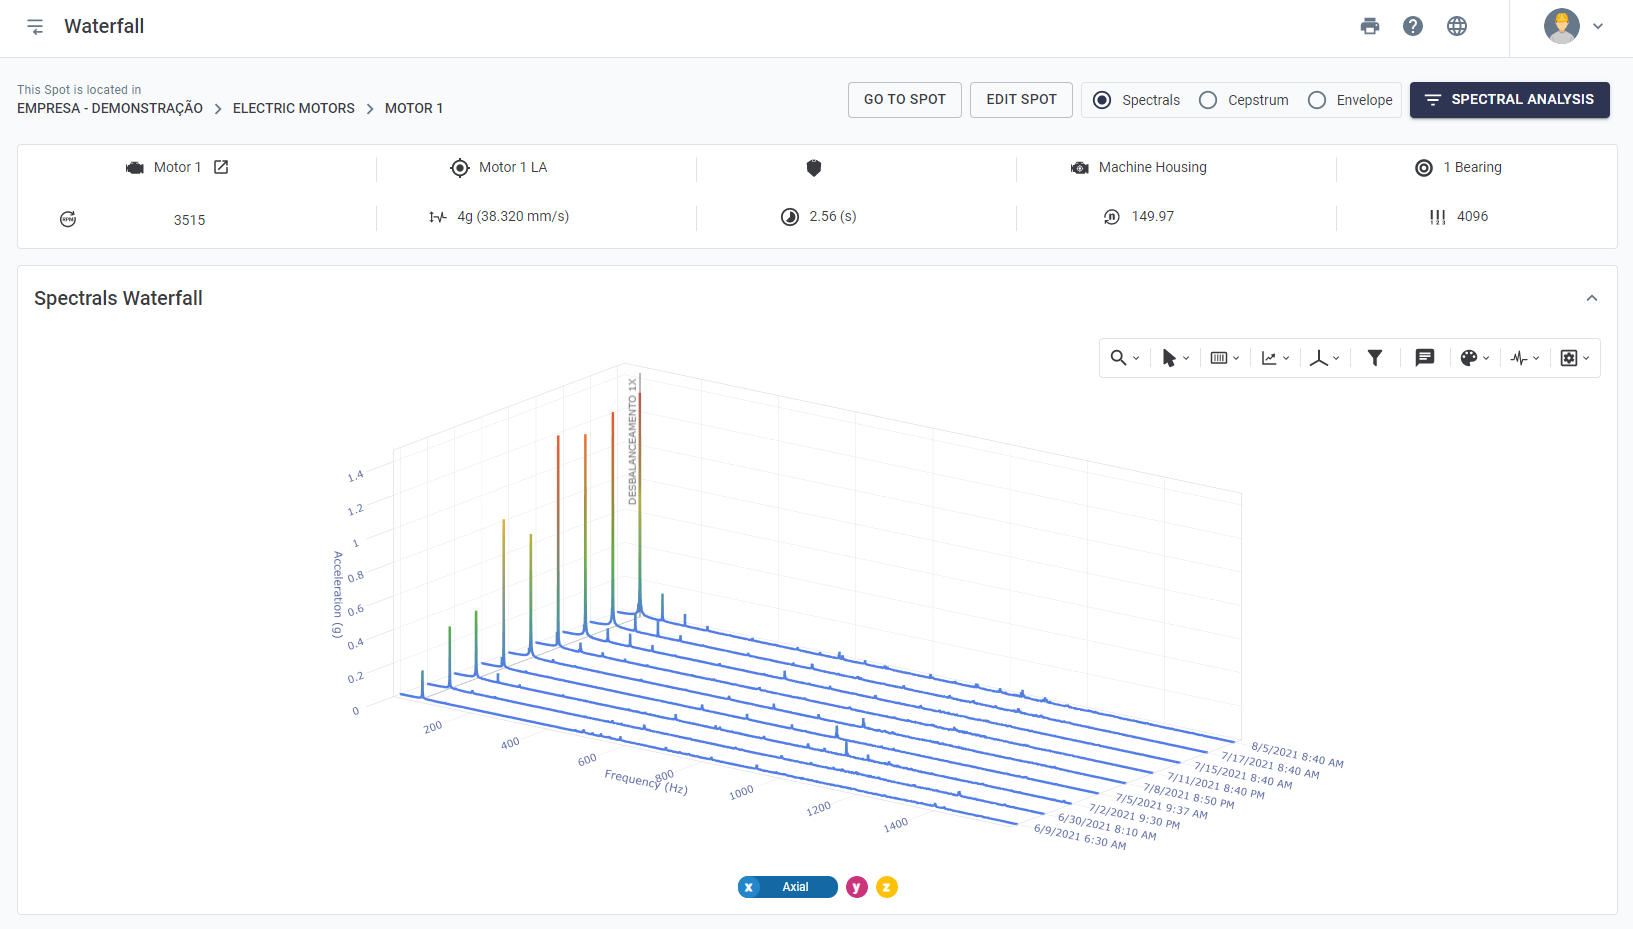
The “Spectra Cascade” screen, which will open next, shows at the top some general information about the monitoring point and the spectra, such as machine, RPM, duration and number of lines.
Below, the waterfall chart and the available tools are displayed. The time period appears on one of the axes, in an increasing manner for a comparison of possible failure evolution.
To facilitate the visualization of the graph, it can be moved to the most suitable position for analysis. The following are the available forms of movement:
- CTRL + Click + mouse movement: lateral movement;
- Click + mouse movement: rotation;
- Scroll mouse button: zoom in or out (graphic).

Waterfall is also available for envelope and cepstro view, as shown above. Enabling either of these options will update the chart to reflect these types of metrics.
In the right corner of the chart some analysis tools are available that can be applied to the waterfall, such as:
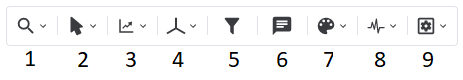
Figure: Spectral cascade visualization tools
1. Zoom tools, which allow you to analyze a specific frequency range of the spectra.
2. Cursor tools, which allow you to add single, harmonic or sideband cursors at specific frequencies.
3. Defining the metric on which the graphs will be displayed below (acceleration, velocity or displacement) and their respective units.
4. Definition of the analyzed axis (X, Y or Z). In the case of triaxial spectra, the user must define which axis will be analyzed each time.
5. Filter tool. High-pass, low-pass and band-pass filters are available for each spectrum of the waterfall.
6.Notes. Tool that allows you to add comments on a specific graph and frequency.
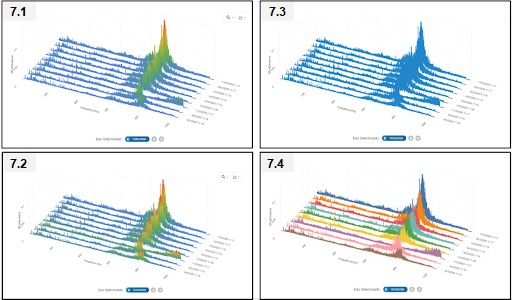
7. Color visualization tool. Definition of the colors of the graphics in a way that facilitates visualization, available in 4 modes.
7.1 Global maximum amplitude: color gradient that takes all spectra into account. Peaks of higher amplitude will be displayed in warm colors.
7.2 Local maximum amplitude: color gradient for each spectrum. Higher amplitude peaks will be displayed in warm colors.
7.3 Pattern per axis: solid color, same for all spectra;
7.4 Individual pattern: solid color, individual for each spectrum.
9. Option to hide/display grid at the bottom of the graph and view the waterfall in logarithmic scale.
Back to articles