Web Platform
9.2) Vibration Spectrum Analysis
Updated at 3/7/2023
When accessing a spectrum in the Web Platform, first the spectral in the frequency domain is displayed for the active, accelerating axes. Information is also available for the velocity and displacement quantities (see Metrics section).
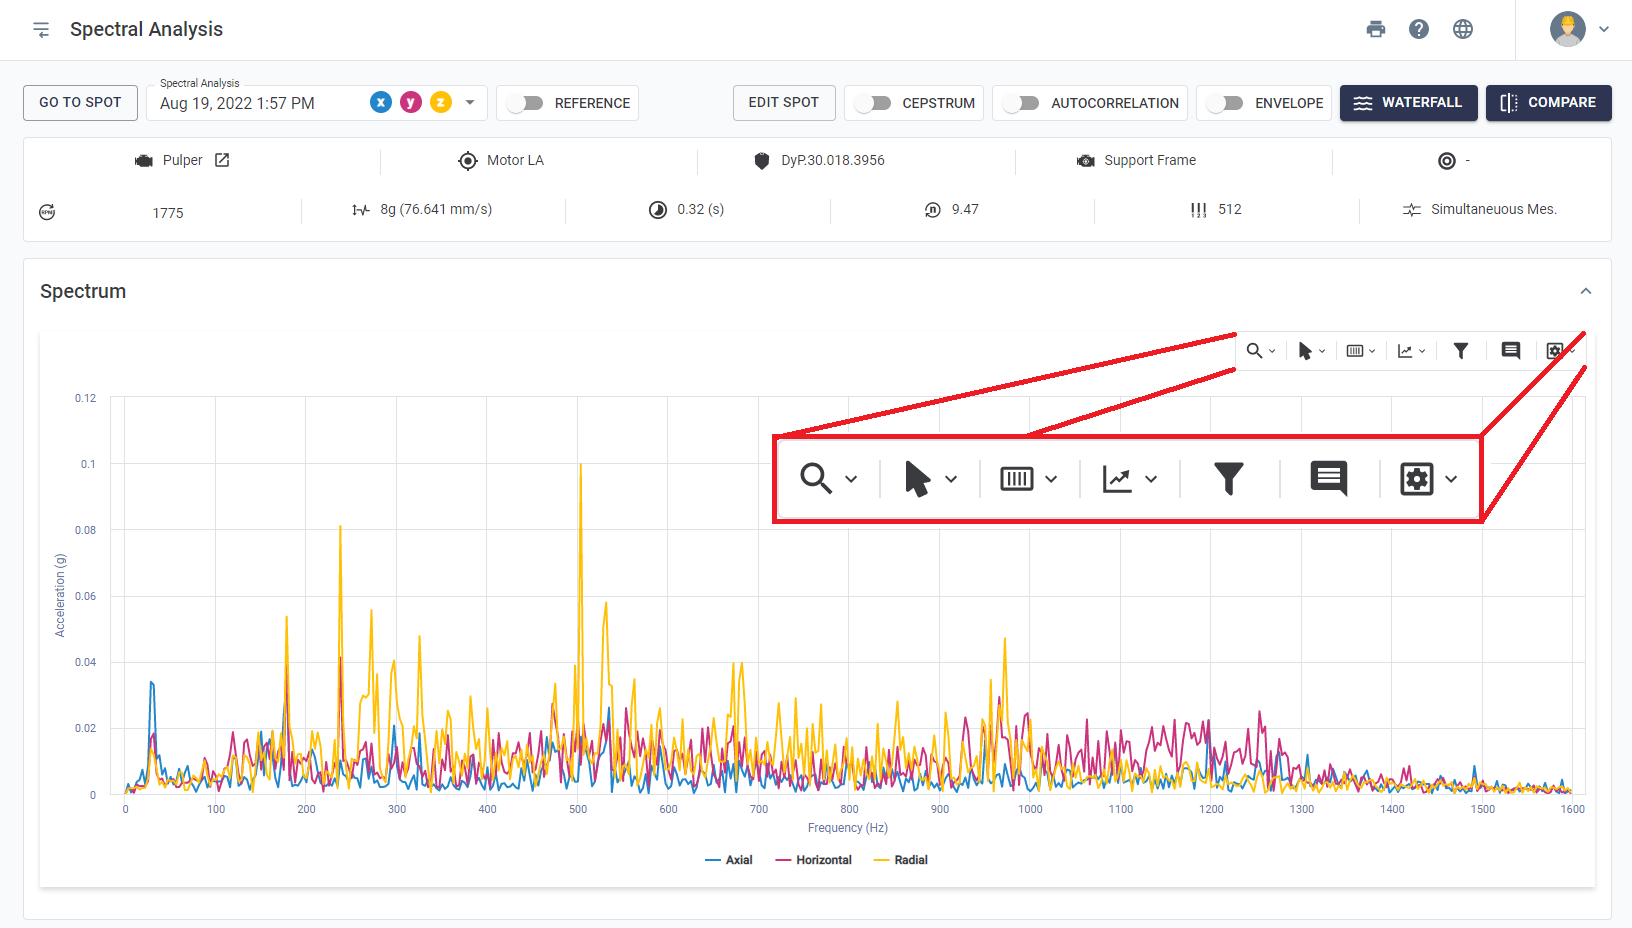
Figure: Spectral analysis and available tools
At the top of the page, information is displayed about which time period the viewed spectral refers to and which axes were collected. By clicking on the rectangle with the date, you can also browse spectra in nearby time periods for a quick visualization.
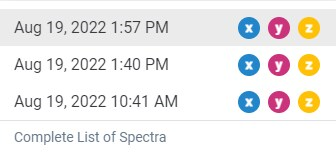
Figure: Spectral Analysis Selection
The following section explains each of the tools in the role upper toolbar:
Zoom Tools
Several functionalities are analogous to the zoom tool of the Spot Viewer, detailed in previous sections. On the other hand, the Spectral Analysis zoom tools have differentiating features, such as keyboard shortcuts, with the objective of boost the way the user relates to the Platform.
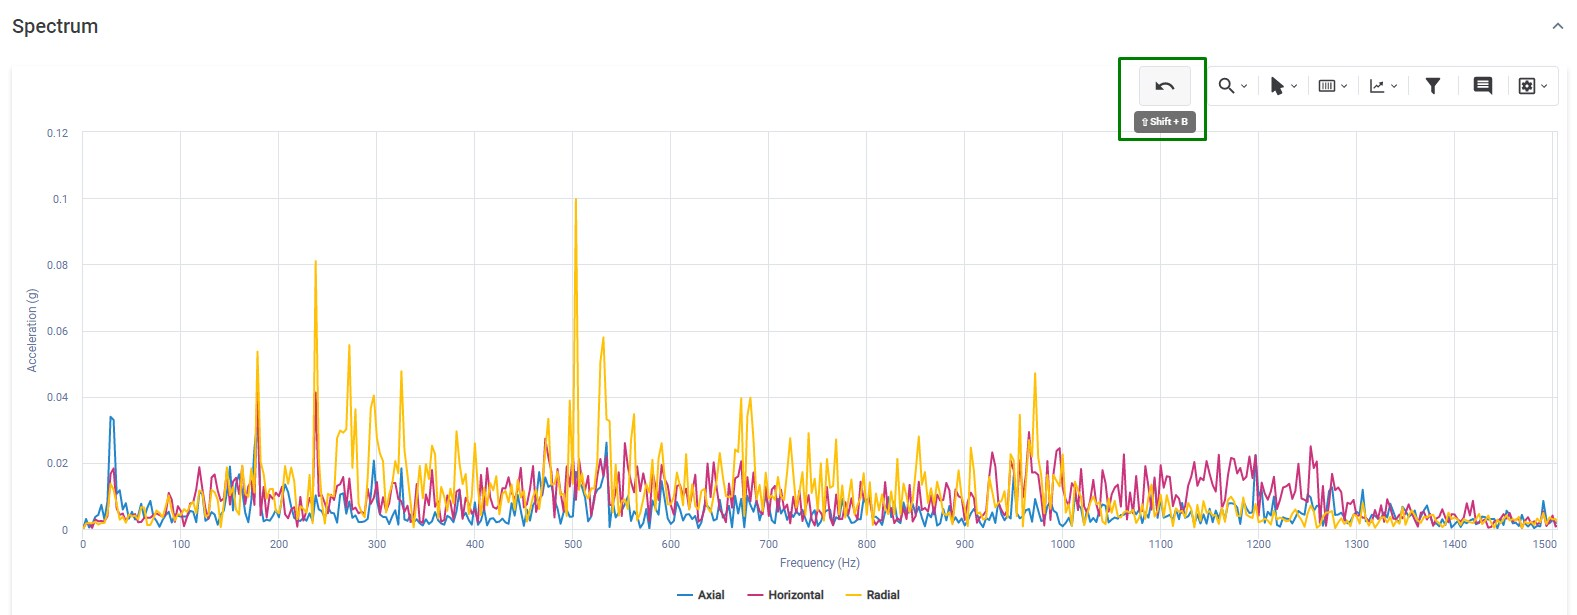
In addition, when zooming in on the graph a return zoom button appears, as it can be seen in the picture below, allowing the user to undo the last zoom command.
Cursor Tools
It is possible to highlight specific frequencies, their harmonics and their sidebands on the graphs. To highlight a specific frequency, simply select the cursor type, place the mouse on the graph and mark. The points corresponding to the selected frequencies will be displayed on the graph, as well as a window with their amplitudes. The cursors are important to analyze, in detail, the frequencies that are being excited in the spectrum, as well as their sources.
The single cursor, as its name suggests, will mark a specific frequency in the spectrum. The harmonic cursor will mark multiples of the chosen frequency. Finally, the sidebands cursor will mark a central and side frequencies, as chosen by the user.
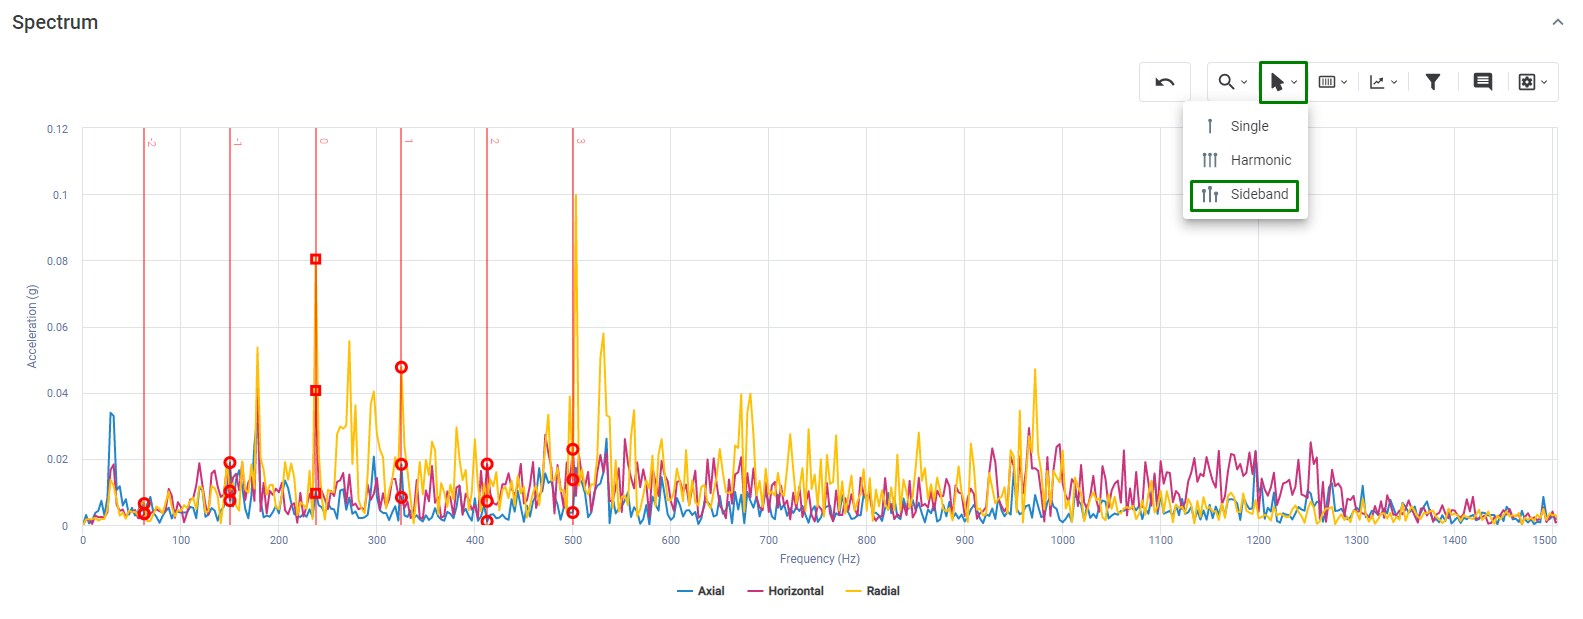
Figure: Cursor Tool
In the Waveform graph the periodic cursor type is available. Finally, to remove a cursor, simply double click on the text box that provides amplitude and frequency values at the highlighted points on the graph.
All cursors have a subtitle indicating the vibration values in each axis at the instant they are positioned. The values are displayed at the bottom of each graph.

Figure: Point-to-point values of the cursors at the bottom of the graph
Automatic Frequency Markers
- RPM: Machine rotation frequency;
- BPFI: Passing frequency of the rolling elements on the innner race;
- BPFO: Passing frequency of the rolling elements on the outer race;
- BSF: Rotation frequency of the rolling elements;
- FTF: Rotation frequency of the cage.
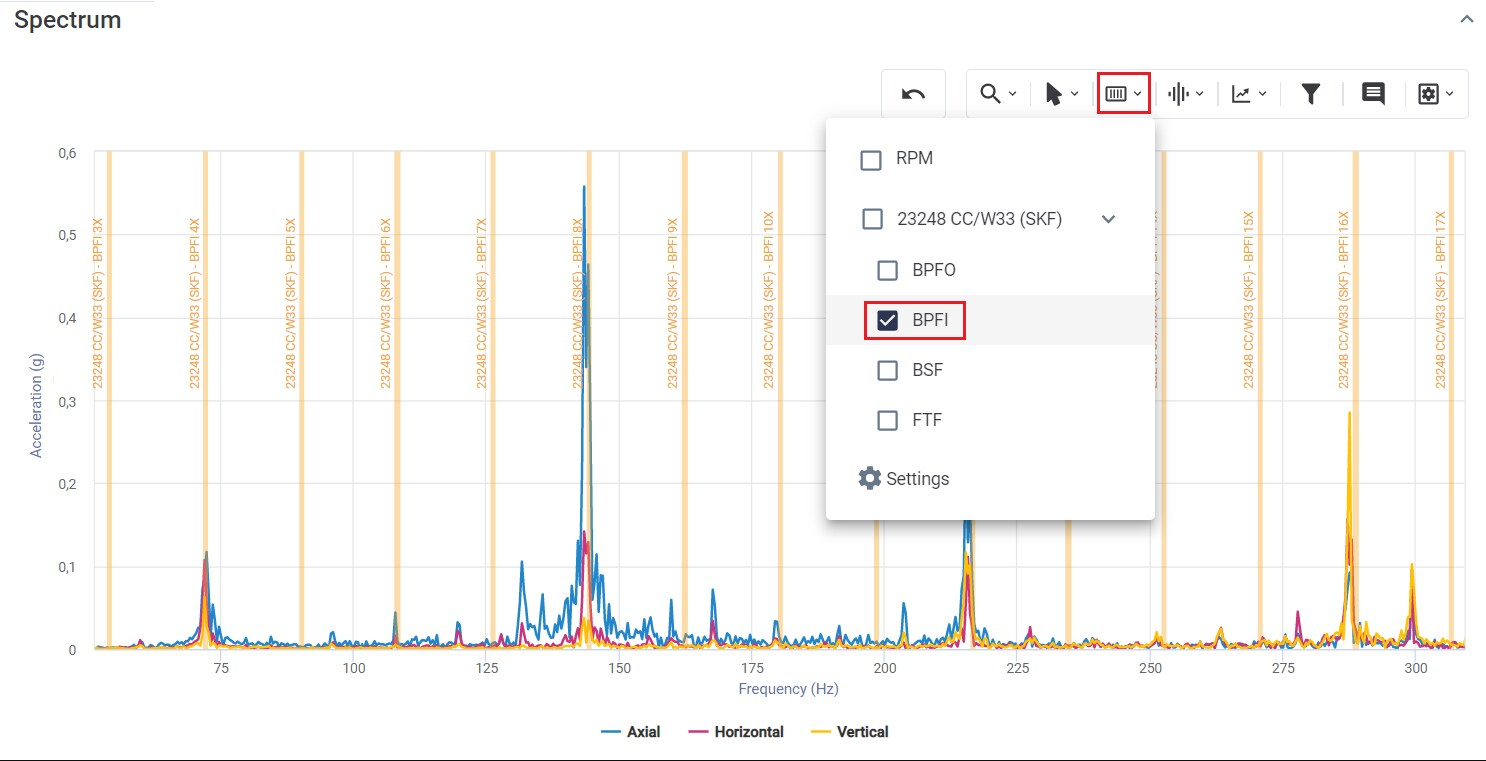
Figure: Tools highlighting rotational frequencies and bearing failures
Customized Frequency Markers
This tool allows the insertion of frequency markers for visualization on spectral graphs. In this way, it will be possible to register the different frequencies present in the machines (blade pass frequency, gearing frequency, electrical failure characteristic frequencies, among others). The process of setting up a custom marker is detailed in the Spot Creation section, on the “Frequencies” tab.
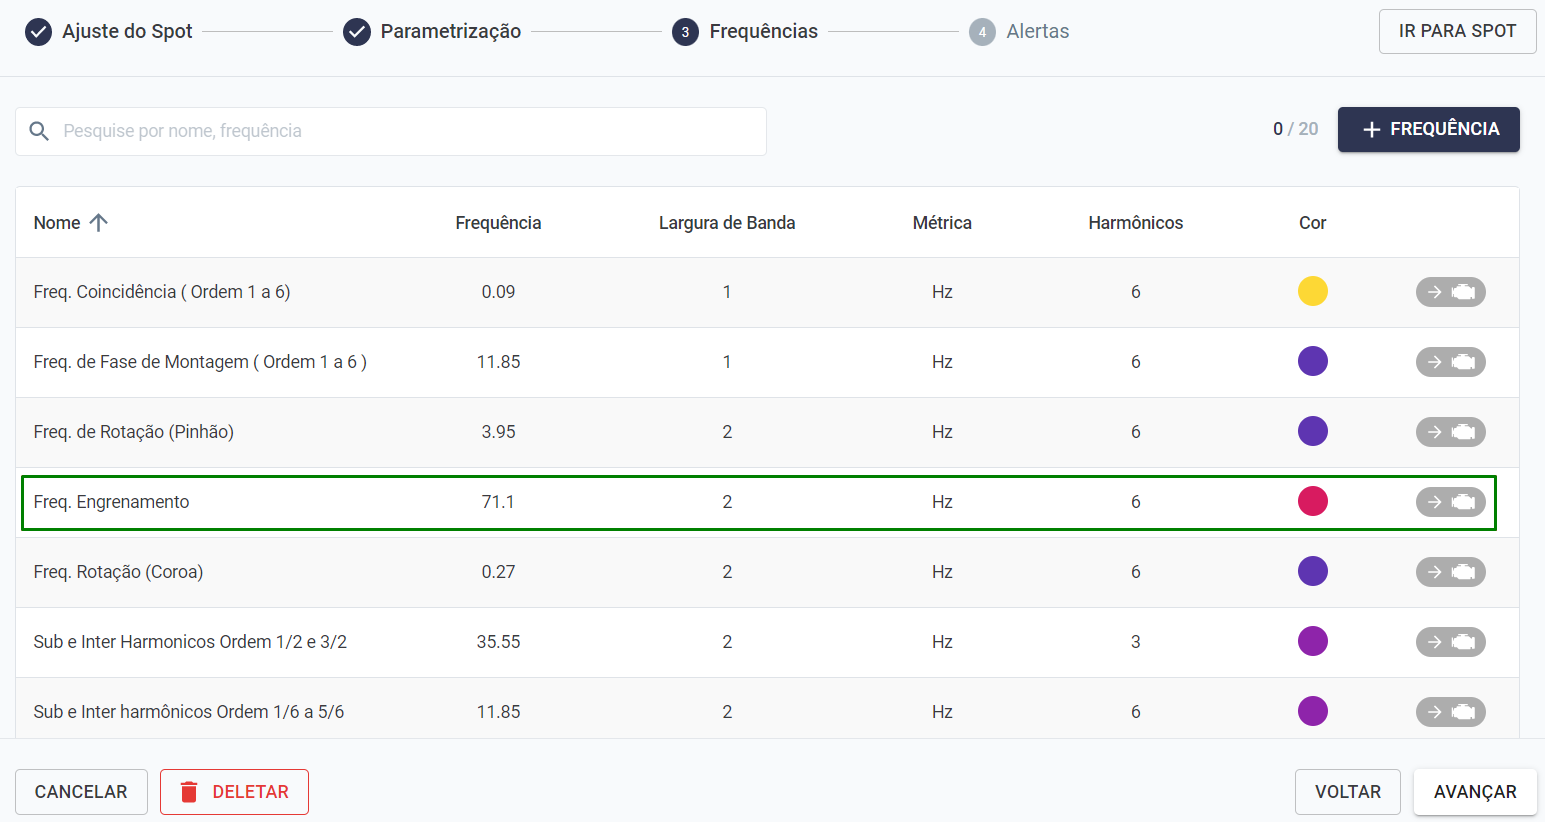
Figure: Customized Frequency Markers
When analyzing a spectral, the marker will be available next to the other tools, via the wave symbol.
Figure: Accessing the custom marker tool
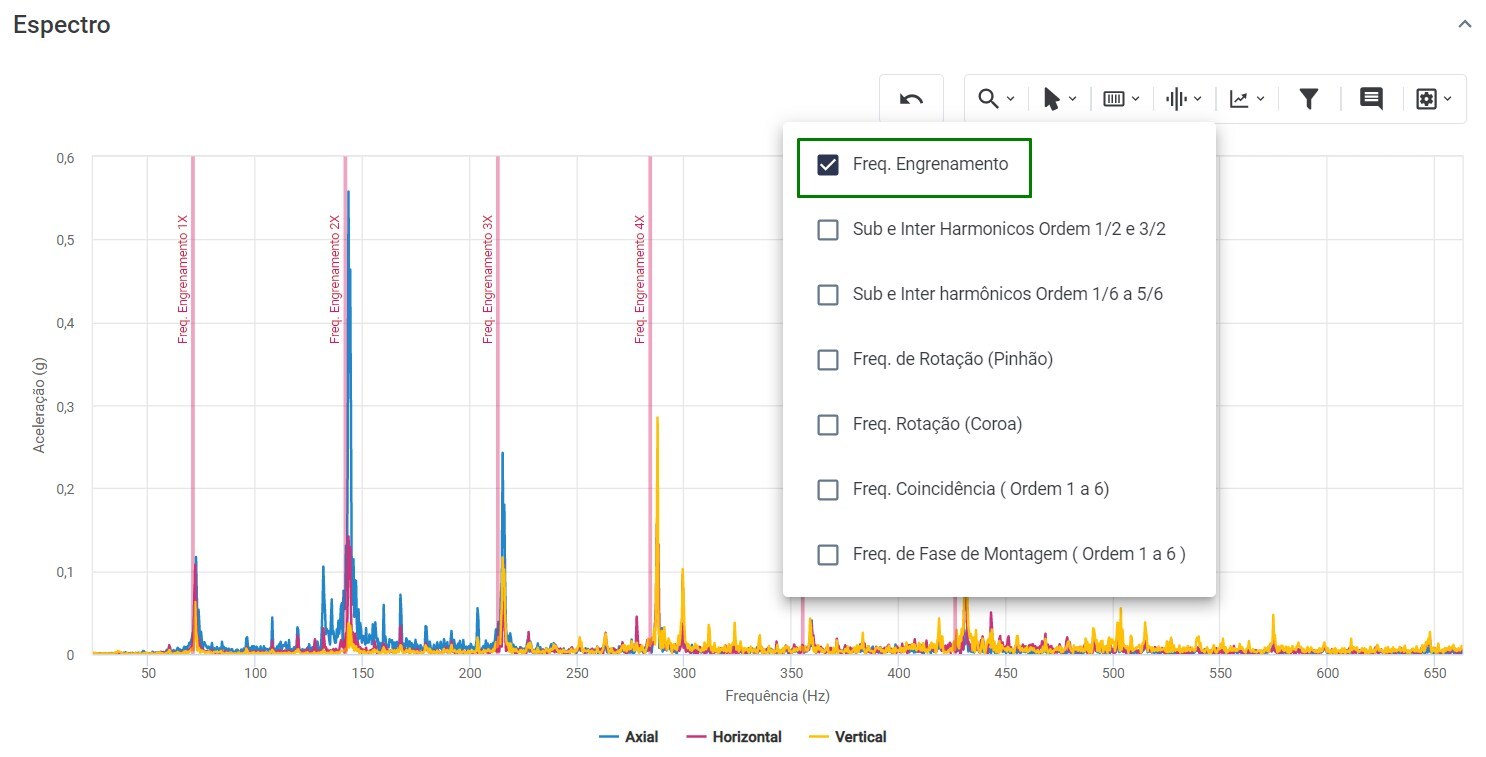
Figure: Cursor tool with customized frequency values
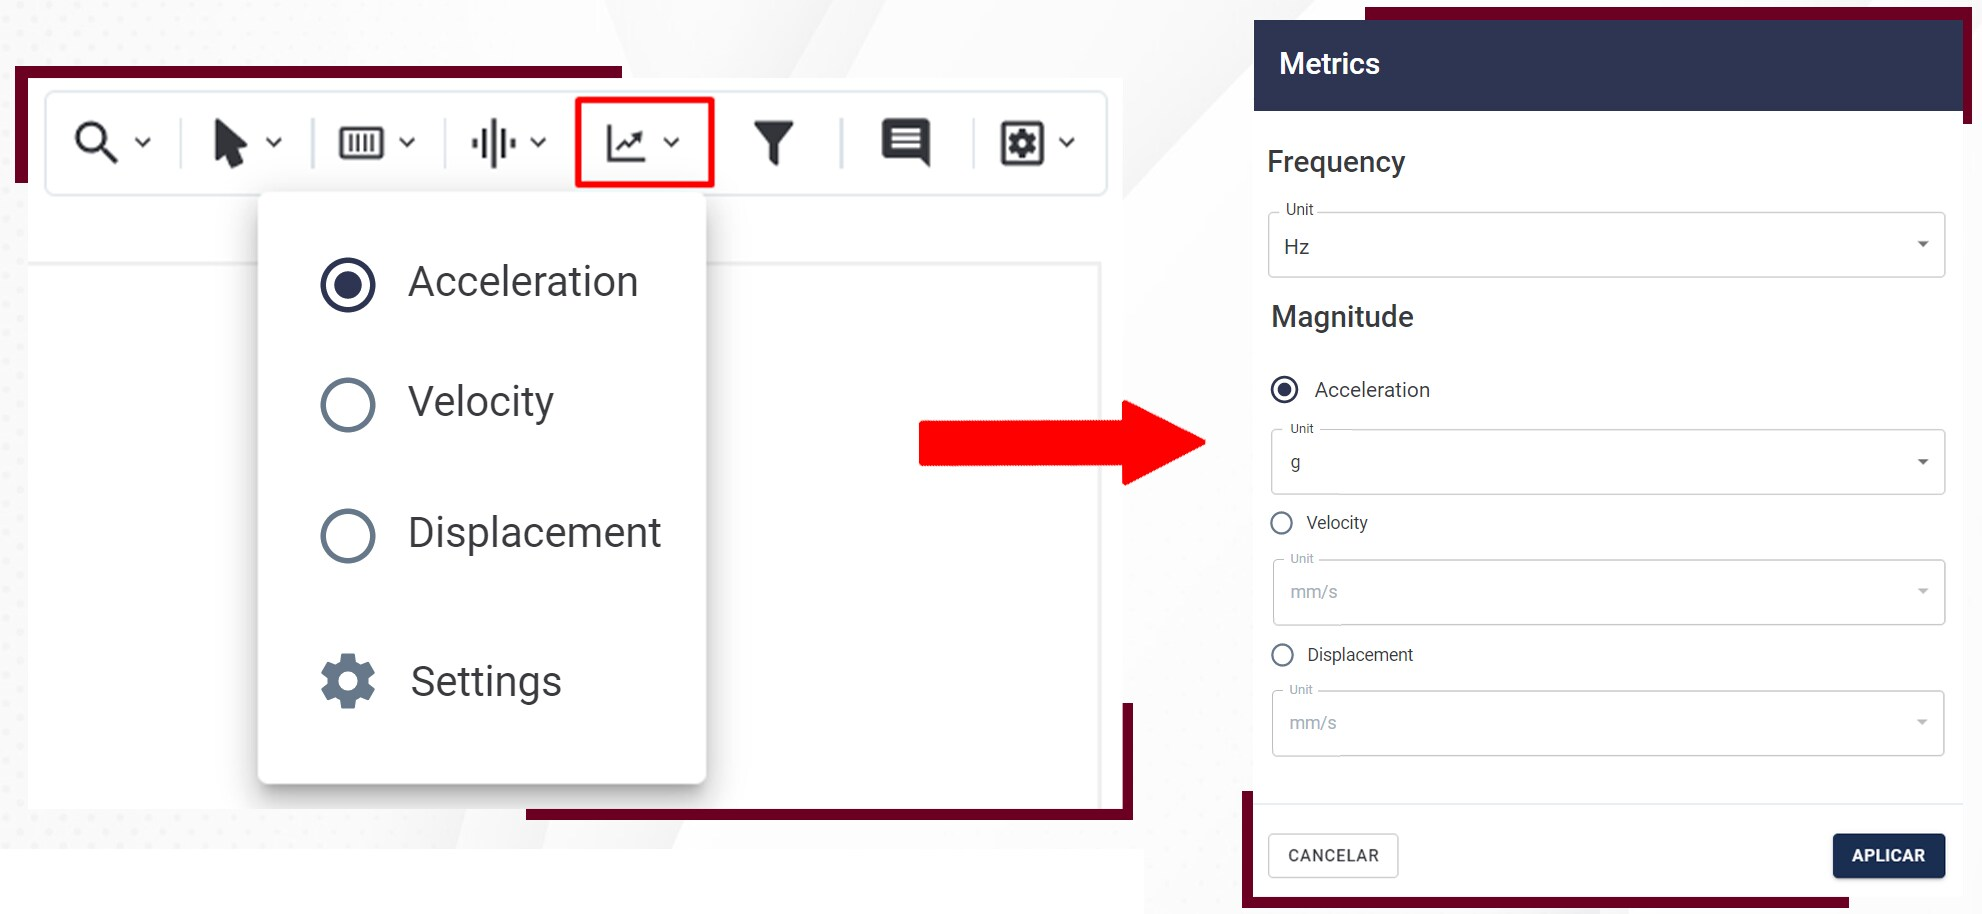
Metrics
Allows you to change the spectral magnitude (acceleration, velocity, or displacement) and their respective units. It can be accessed through the toolbar above the spectral graphs shown.
Filter Tools
It is possible to apply filters that help eliminate noise and highlight characteristics of the signal. When you select the option, a new window will open where you can choose the desired filter type and cutoff frequencies.

Figure: Accessing the filter tool
The options are: ‘High Pass’, ‘Low Pass’, ‘Band-Pass’, ‘Center Frequency’ filters.
The objective of the DMA Dashboard is to support maintenance decision making and interventions by providing an overview of the Spots condition, based on previous measurements and user-defined alarms (A1 and A2).
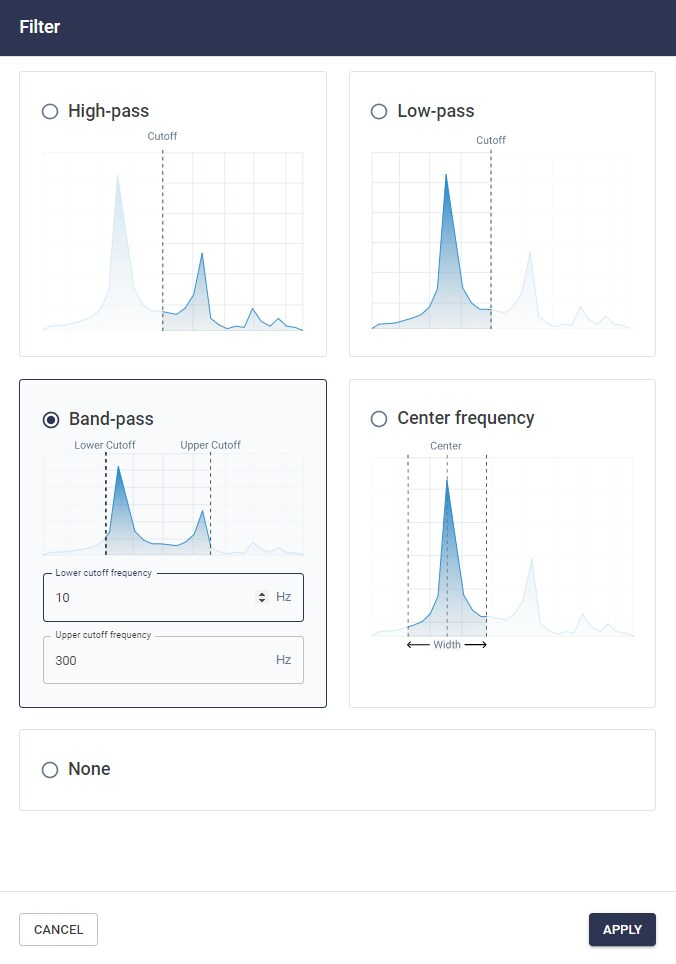
Figure: Filters tool
The shortcut for using filters on graphics is ( Shift + F ).
Notes
It is possible to add notes to custom frequencies. The annotations serve to assist the analyst in viewing the spectral analysis graph more clearly and objectively.

Picture: Accessing the note tool
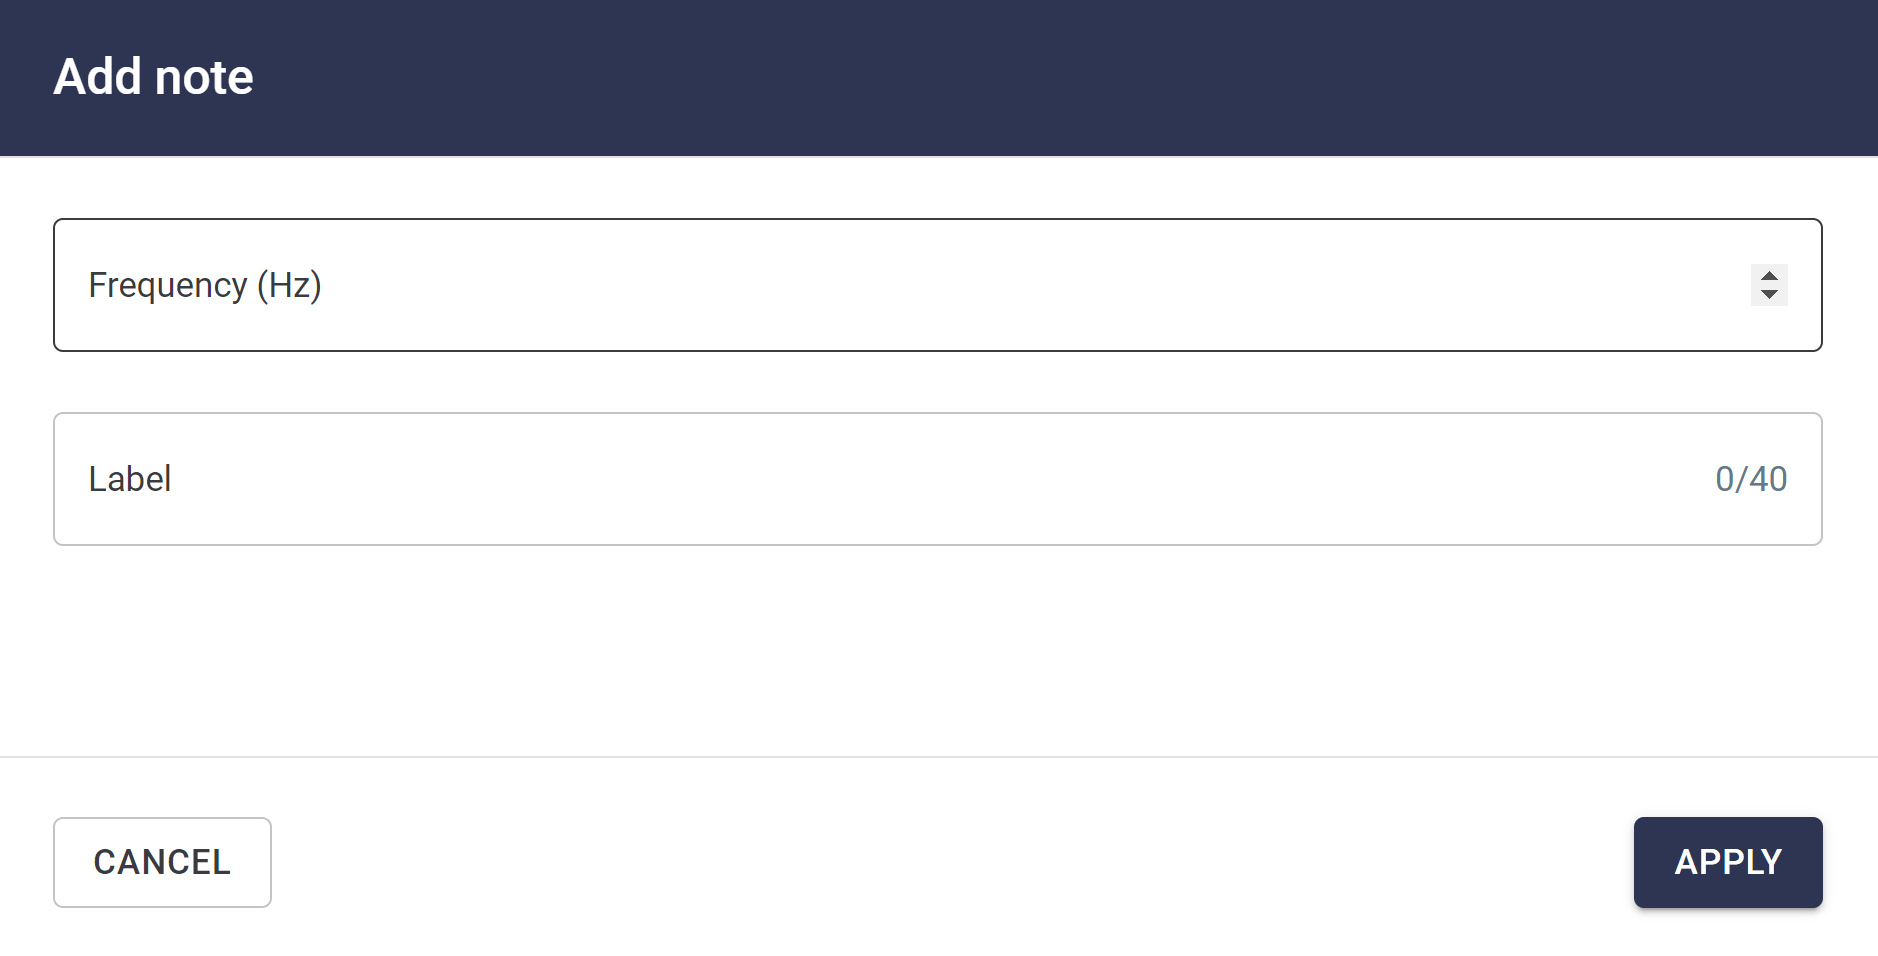
Figure: Add notes on specific frequency
Visualization Options
The series of visualization options, which can be accessed from the top right menu, encompasses a number of functionalities, including: plotting grid lines, viewing the graph in logarithmic scale, which can fault defect detection on slow rotating machines, or displaying the text boxes of cursors added via the “Cursor tooltip” option.
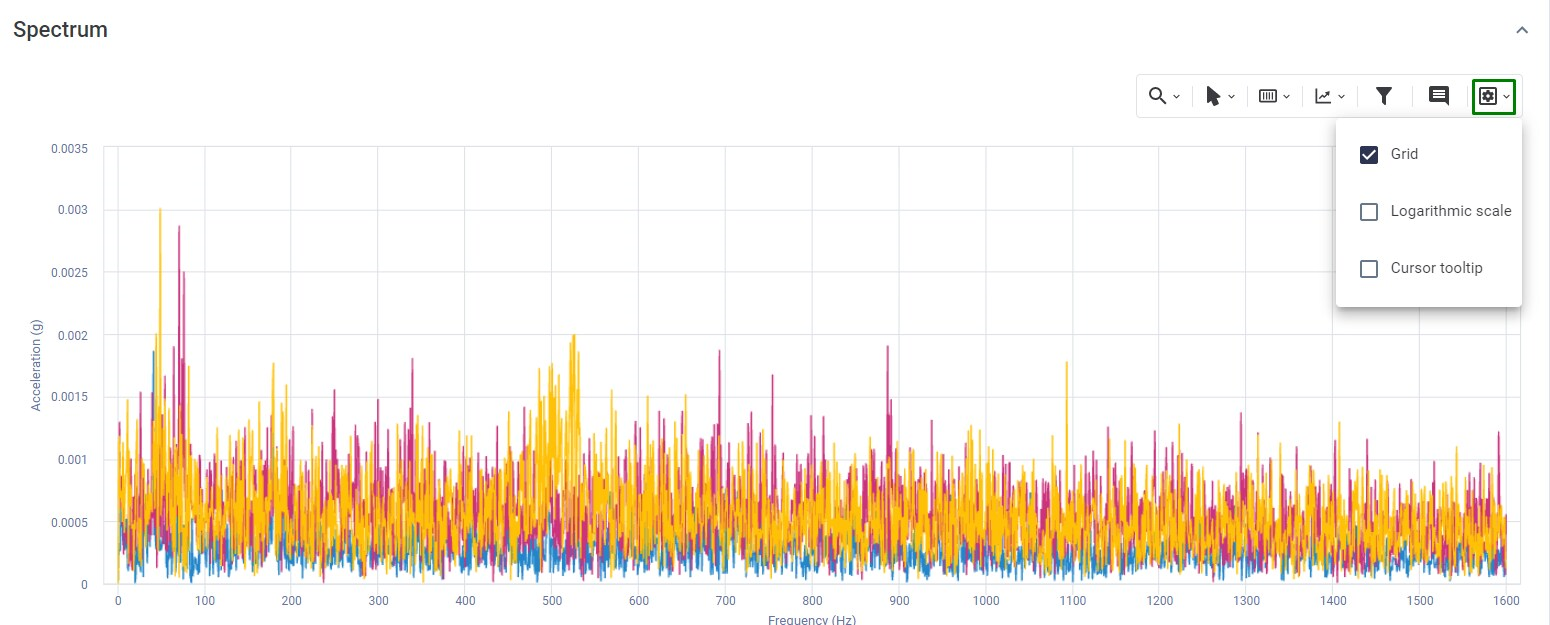
Figure: Visualization Options
Spectral Chart Shortcuts
Aiming at the dynamic use of the Platform, the Spectral Charts have several shortcuts that encompass the main tools for analyzing vibration spectra. The shortcuts are arranged as shown in the table.
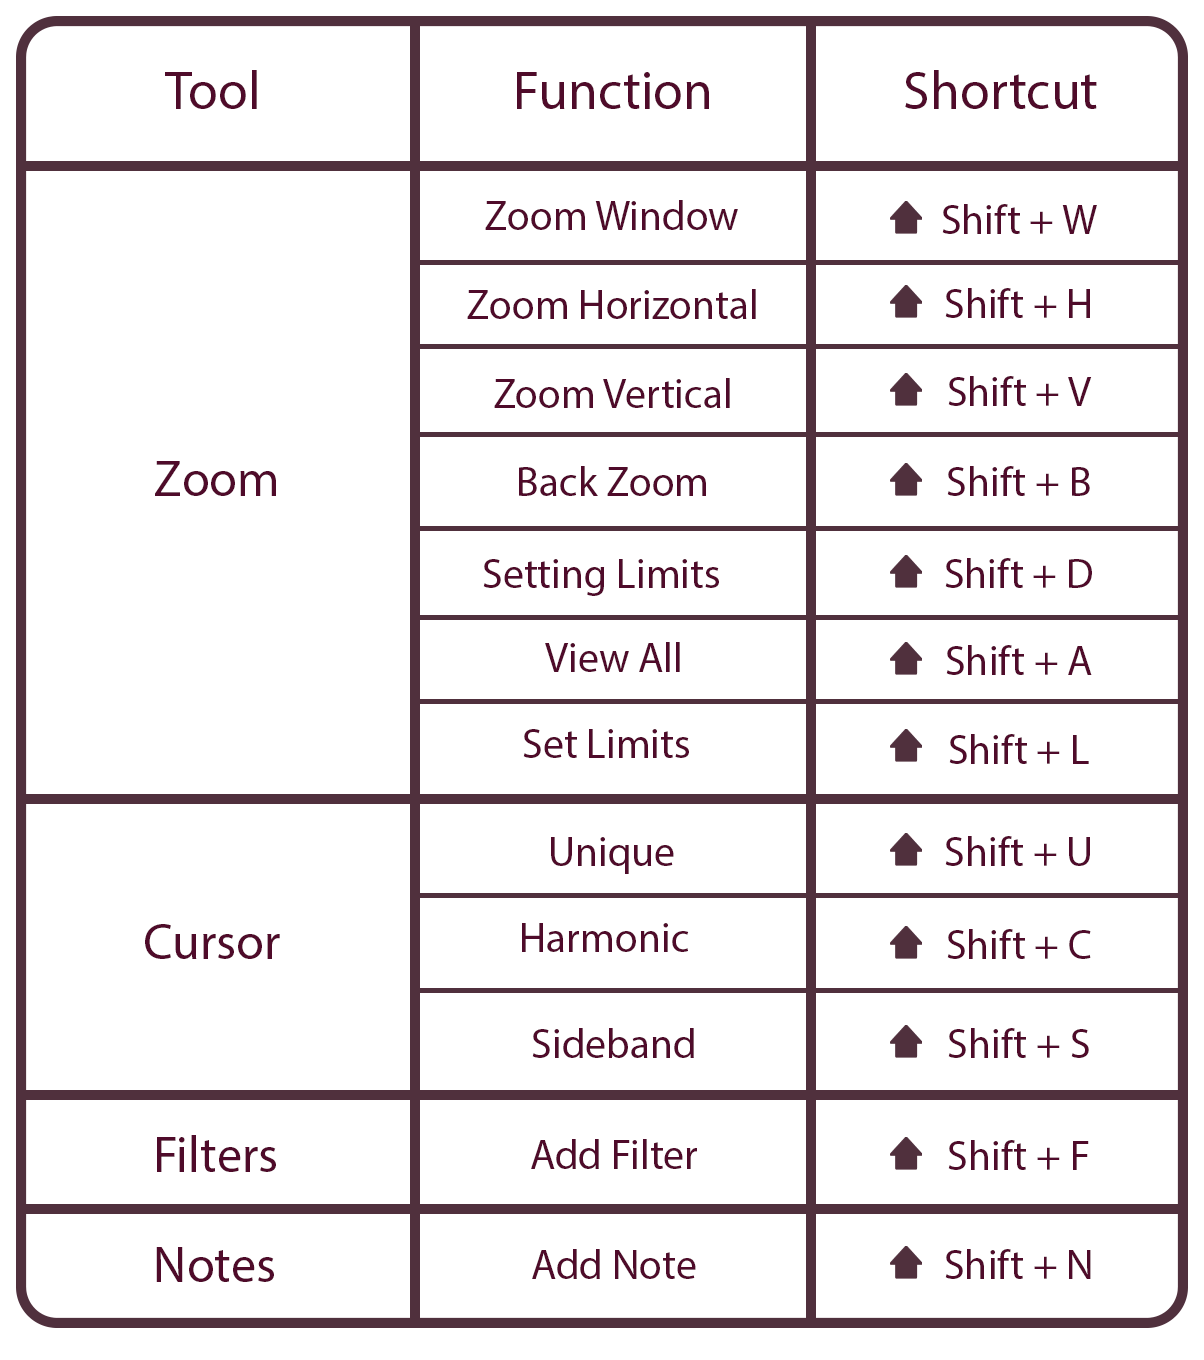
Figure: Spectral chart shortcuts
Back to articles