Web Platform
8.3) Compare Tool
Updated at 3/7/2023
The Compare tool allows to compare continuous data from different time periods side by side.
The option is available in the upper right corner of the Spot Viewer screen.
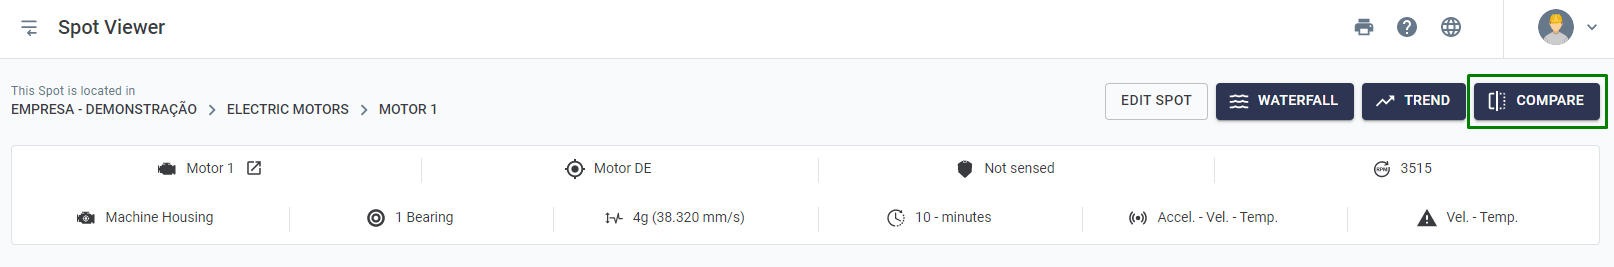
Picture: Compare tool
After selecting the desired Spot, the data will appear side by side. You can change the desired period on each side.
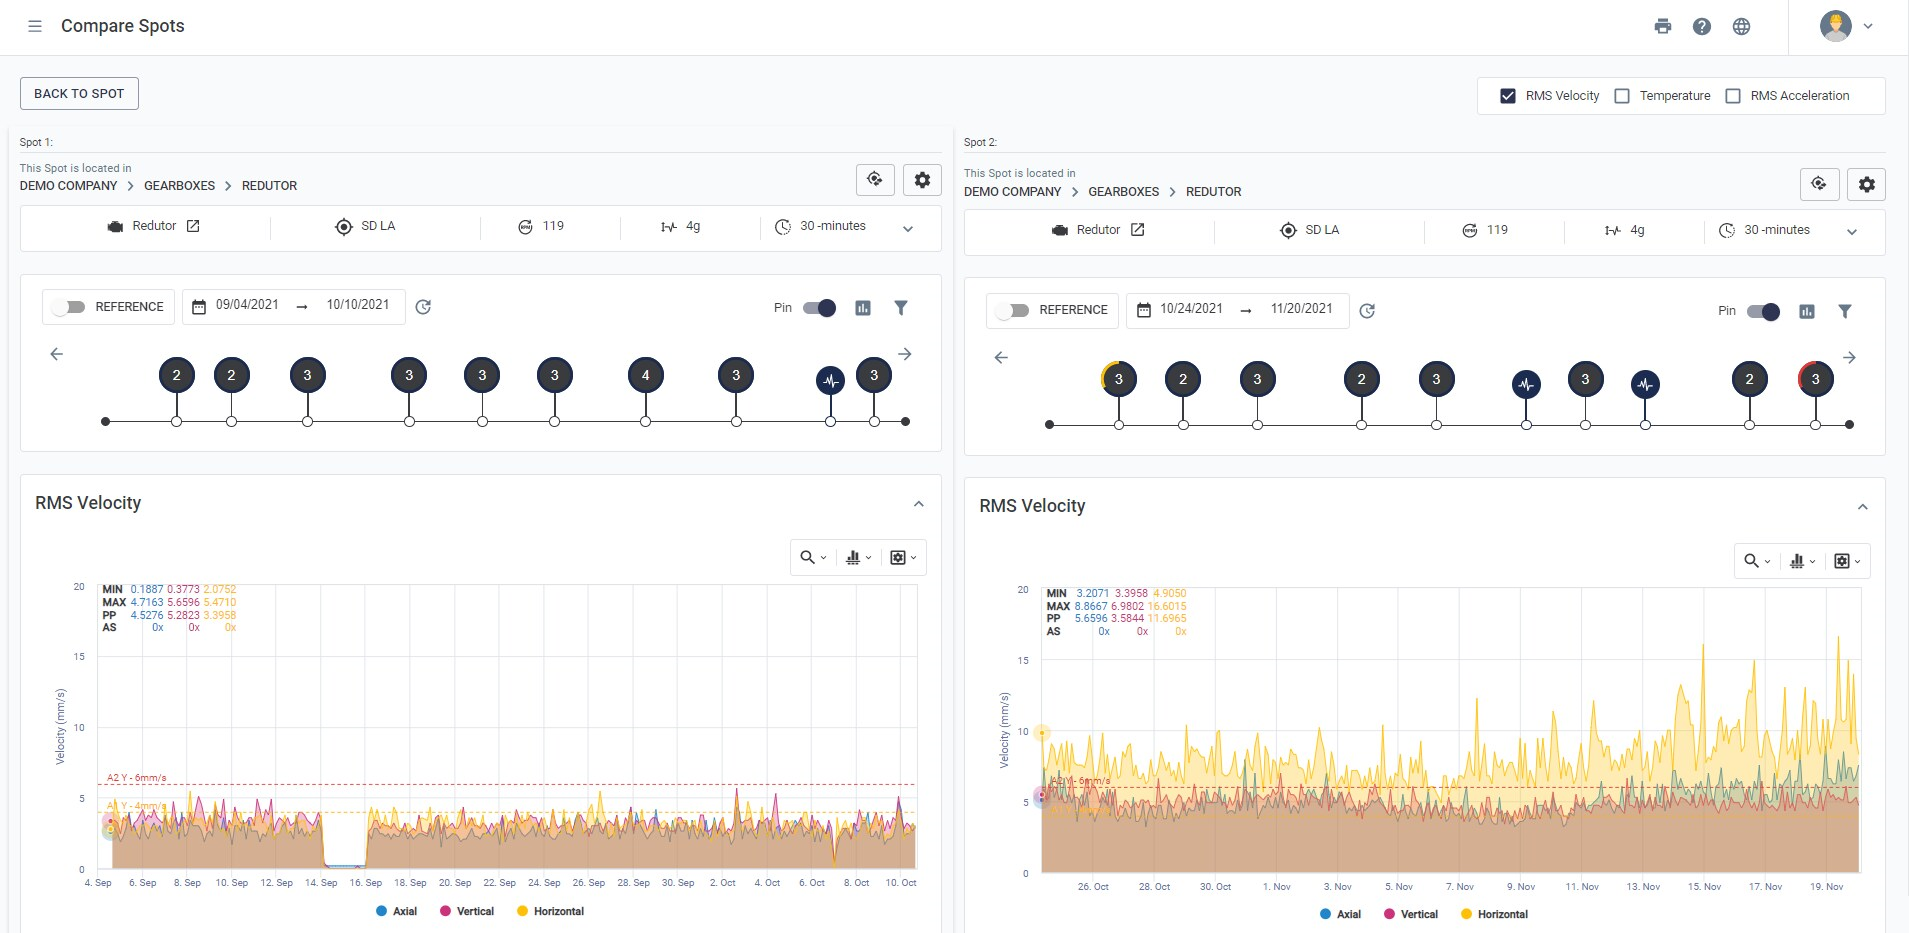
Figure: Comparison of continuous data from a conveyor belt bearing.
Left side: post-maintenance levels. Right side: high levels, intervention report already issued.
This tool can be relevant for adding comparison images to the reports / predictive analyses, thus making the reports more complete and visual.
Note: It is possible to compare two different Spots in different time periods. The customization and choice is under the user’s control. It is worth mentioning that all analysis tools, markers and the tools alike are also available in the comparison view.
Back to articles