Web Platform
8.1) Web: Timeline in the Spot Viewer
Updated at 3/7/2023
After the Spot’s header registration, the Timeline is displayed, which chronologically presents the events that occurred in the Spot during the selected period.
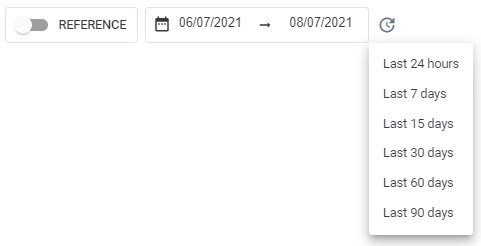
To navigate through the calendar, you can click on it, just above the timeline, to set the start and end of the displayed data.
By default, the Platform shows the period referring to the last 7 days. For a better usability of the user, by clicking on the “![]() ” icon, to the right of the calendar, it is possible to select pre-selected periods, among them: last 24 hours, last 7, 15, 30, 60, or 90 days.
” icon, to the right of the calendar, it is possible to select pre-selected periods, among them: last 24 hours, last 7, 15, 30, 60, or 90 days.

Figure: Calendar of the spot viewer screen
Currently there are several types of events: continuous data collection, spectral analysis collection, report emission (predictive analysis), Spot parameterization, Spot created/deleted, A2 Alert, and commented events only.

Figure: Timeline and events related to the Spot
The interactive icons displayed on the timeline follow the pattern below:![]() Spectral Analysis: through this icon the user can access a spectral analysis performed in Spot. After clicking on the icon, a tab will be displayed with information such as creation date, selected axes, the person responsible and the event agent, the synchronization date, preview of the graph for user viewing, among others.
Spectral Analysis: through this icon the user can access a spectral analysis performed in Spot. After clicking on the icon, a tab will be displayed with information such as creation date, selected axes, the person responsible and the event agent, the synchronization date, preview of the graph for user viewing, among others.
![]() Collection: Collection available data from the sensor memory based on the sample interval chosen for the Spot. This event, as well as the Spectral Analysis, can be generated by Gateway or by an inspector collecting on field via mobile application. By clicking on the icon it is possible to know the source of the collection as well as its time information.
Collection: Collection available data from the sensor memory based on the sample interval chosen for the Spot. This event, as well as the Spectral Analysis, can be generated by Gateway or by an inspector collecting on field via mobile application. By clicking on the icon it is possible to know the source of the collection as well as its time information.
![]() Parameterization Event: editing event performed by a user. By clicking on the event it is possible to see which changes were made, who was responsible for it and at what moment (on the timeline).
Parameterization Event: editing event performed by a user. By clicking on the event it is possible to see which changes were made, who was responsible for it and at what moment (on the timeline).![]() Predictive Report: issuing predictive analysis report, based on data from vibration and temperature sensors. By clicking on the icon, the information of the user who performed the analysis and the shortcut for the report will be displayed. This icon has color interactivity, that is, its color is displayed according to the criticality assigned by the analyst when making the report. By default, there are: green, yellow and red, which relate, respectively, to normal, alert and intervention levels.
Predictive Report: issuing predictive analysis report, based on data from vibration and temperature sensors. By clicking on the icon, the information of the user who performed the analysis and the shortcut for the report will be displayed. This icon has color interactivity, that is, its color is displayed according to the criticality assigned by the analyst when making the report. By default, there are: green, yellow and red, which relate, respectively, to normal, alert and intervention levels.
![]() A2 Alert: Alert type A2 triggered on the Spot. Clicking on the icon will display information such as: agent (Gateway or application collection), metric (velocity, acceleration, or temperature), time that the Spot was above specified levels and the configured value of alerts across all metrics.
A2 Alert: Alert type A2 triggered on the Spot. Clicking on the icon will display information such as: agent (Gateway or application collection), metric (velocity, acceleration, or temperature), time that the Spot was above specified levels and the configured value of alerts across all metrics.
![]() Spot Created/Deleted: Spot creation event visualized. Clicking on the icon will display information about the user who created the spot, the settings made and through which device (application or platform) the monitoring point was created. In the case of a Spot deletion event, the icon will appear in gray.
Spot Created/Deleted: Spot creation event visualized. Clicking on the icon will display information about the user who created the spot, the settings made and through which device (application or platform) the monitoring point was created. In the case of a Spot deletion event, the icon will appear in gray.
All icons can be accessed by selecting their respective functionality in the alternatives menu of the event filter.

Figure: Timeline events filter
There is also the option to pin or unpin the timeline from the top of the page, using “![]() “. Next to this is the “
“. Next to this is the “![]() ” icon, which takes the user to a tabular view of the spot timeline, entitled Event Report. This type of data visualization follows the same pattern of icons used in the timeline described above. Similarly, information about the user who performed the action and which Spot was involved in the event is displayed.
” icon, which takes the user to a tabular view of the spot timeline, entitled Event Report. This type of data visualization follows the same pattern of icons used in the timeline described above. Similarly, information about the user who performed the action and which Spot was involved in the event is displayed.
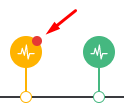
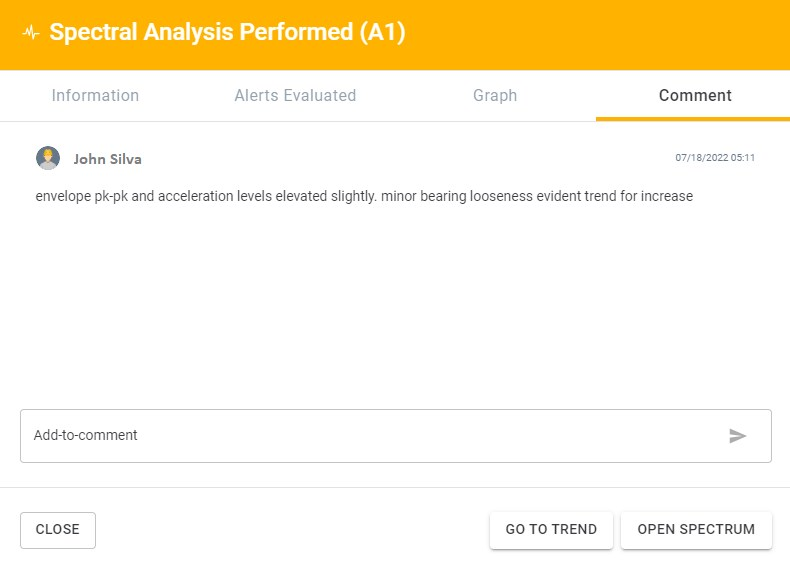
Users are also able to leave comments on a timeline event (collection, spectral, parameterization) that can be answered by other colleagues in the form of a “conversation”. Each comment has date/time information and it will be possible for users to edit or delete their own comments. Events that have comments appear on the timeline highlighted with a red circle, shown in the example below:


Back to articles