Web Platform
6) Dashboard DMA
Updated at 3/8/2023
The goal of the DMA Dashboard is to support maintenance decision making and interventions by providing an overview of the Spots condition, based on previous measurements and user-defined alerts (A1 and A2).
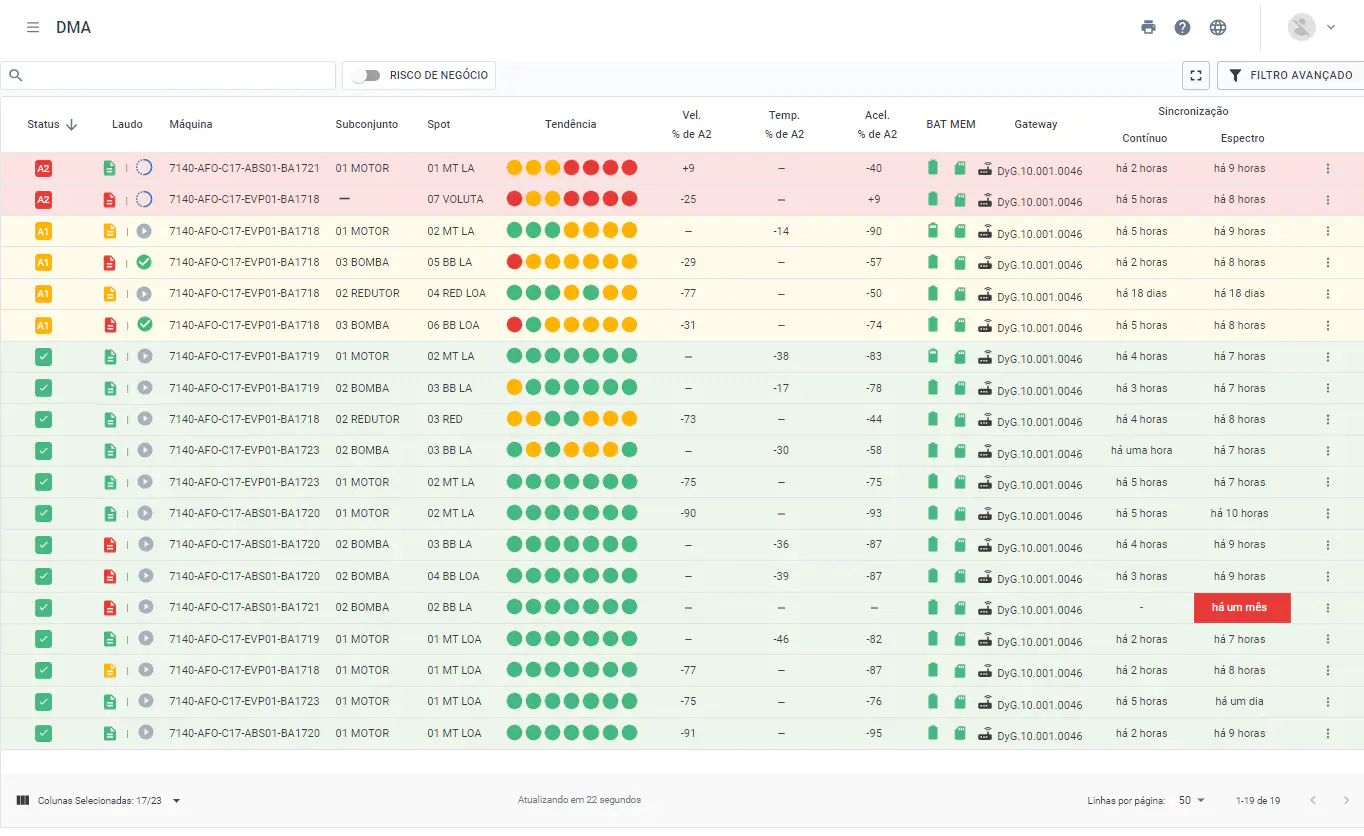
Figure: DMA Dashboard
The Dashboard consists of the following columns:
Status: shows the current state of the spot, informing whether it has exceeded the A1 and A2 alert limits, of continuous level or by band, defined in the spot’s registration. The status is updated at each new collection performed by the application or by the Gateway.
Report: status of the last “predictive analysis” performed, as well as the status of progress (open, in progress, resolved). By clicking on any of the report icons, the respective predictive report previously performed by the analyst will be opened.
Machine: Name of the machine to which the Spot is registered.
Subset: subdivision of a machine, according to the asset tree.
Component: subdivision of a subarea, according to the asset tree.
Spot: name of the monitoring point.
Trend: analyzes the Spot’s variation over time. Each circle represents the worst alert level (A1 and A2) exceeded for each of the last seven days prior to the last collection date. By hovering the cursor over the circles, it is possible to view the date, the alert violated, and the estimated time that this Spot was on alert.
Median Velocity: median value of the RMS velocity on the day of collections. The arrow next to the value indicates the variation from the day before the last collection.
Median Temperature: median value of the temperature, in ºC, on the day of collections. The arrow next to the value indicates the variation in relation to the day before the last collection.
Median Acceleration: median value of the RMS acceleration on the day of collections. The arrow next to the value indicates the variation in relation to the day before the last collection.
Vel % of A2: Displays the percentage difference between the median value in RMS velocity and the A2 alarm level, in relation to the last day of collections. To learn how to configurate these levels, please refer to “Spots Creation / Configuration”. This indicator considers the configuration of “Spot operating levels” in order to disregard downtime values.
Temp % of A2: resents the percentage difference between the median value in temperature and the A2 alarm level, in relation to the last day of collections. This indicator considers the configuration of “Spot operating levels” in order to disregard downtime values.
Accel % of A2: presents the percentage difference between the median value in RMS acceleration and the A2 alarm level, in relation to the last day of collections. This indicator takes into account the configuration of “Spot operating levels” in order to disregard downtime values.
BAT: Estimation of the remaining battery of the DynaLogger associated to the Spot.
MEM: indicates the remaining storage capacity of the DynaLogger memory. The memory length depends on the sampling interval, i.e. how often the DynaLogger collects and stores data. This interval can be queried by hovering the mouse over the memory card icon of the desired spot. They are divided into 4 colors:![]() More than 40% free memory.
More than 40% free memory.
![]() Between 20% and 40% free memory.
Between 20% and 40% free memory.![]() Less than 20% free memory;
Less than 20% free memory;
![]() Memory full. When this happens, the DynaLogger stops collecting data, keeping the already collected data.
Memory full. When this happens, the DynaLogger stops collecting data, keeping the already collected data.
Note: Whenever data from a DynaLogger is collected, either by the Application or by the Gateway, the internal memory of the device gets cleared.
Gateway: if the Spot is associated with a gateway, for automated collection, the gateway’s serial number will be shown. If the user wants to access information about a specific gateway, just click on the serial number.
Last General Synchronization: Shows the date of the last synchronization, that is, the date of the last measurement collected for this Spot.
Last Continuous Synchronization: Shows the date of the last continuous synchronization, that is, the date of the last continuous data collection collected for this Spot.
Last Spectral Synchronization: shows the date of the last spectral synchronization, that is, date of the last spectrum for that spot.
Filter Columns in Tables: through the “![]() ” option located in the lower left corner of the DMA screen, a window opens listing all columns that can be displayed/hidden. This allows the user to determine which columns will be shown in the tables, in order to display only the relevant items to the analysis at the time.
” option located in the lower left corner of the DMA screen, a window opens listing all columns that can be displayed/hidden. This allows the user to determine which columns will be shown in the tables, in order to display only the relevant items to the analysis at the time.
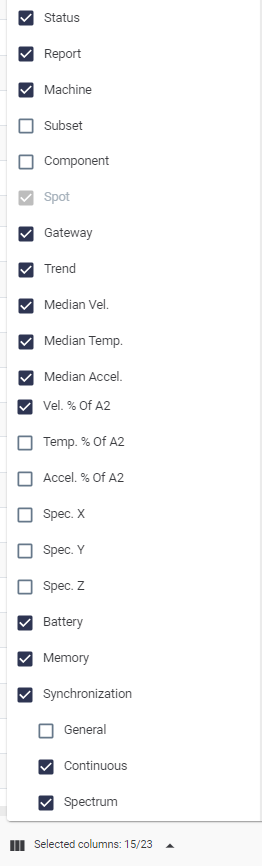
Figure: Selectable columns in the DMA
In addition, in the upper left corner of the page there is a search bar and an advanced filter, which allows you to search by various options, such as by a machine, Spot, or serial number of a specific DynaLogger.

Figure: Advanced filters and search bar
In addition, by selecting the “
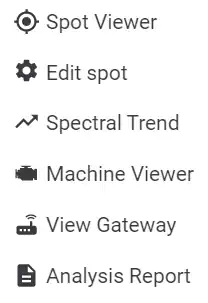
Figure: Navigation shortcuts
Back to articles