Web Platform
3.5) Viewing Preferences
Updated at 3/8/2023
Also within the Spot Center, it is possible to define standardized visualization parameters for different screens of the Web Platform. The objective is to save viewing preferences for the referred Spot, in order to make navigation faster and, consequently, gain productivity in analysis.
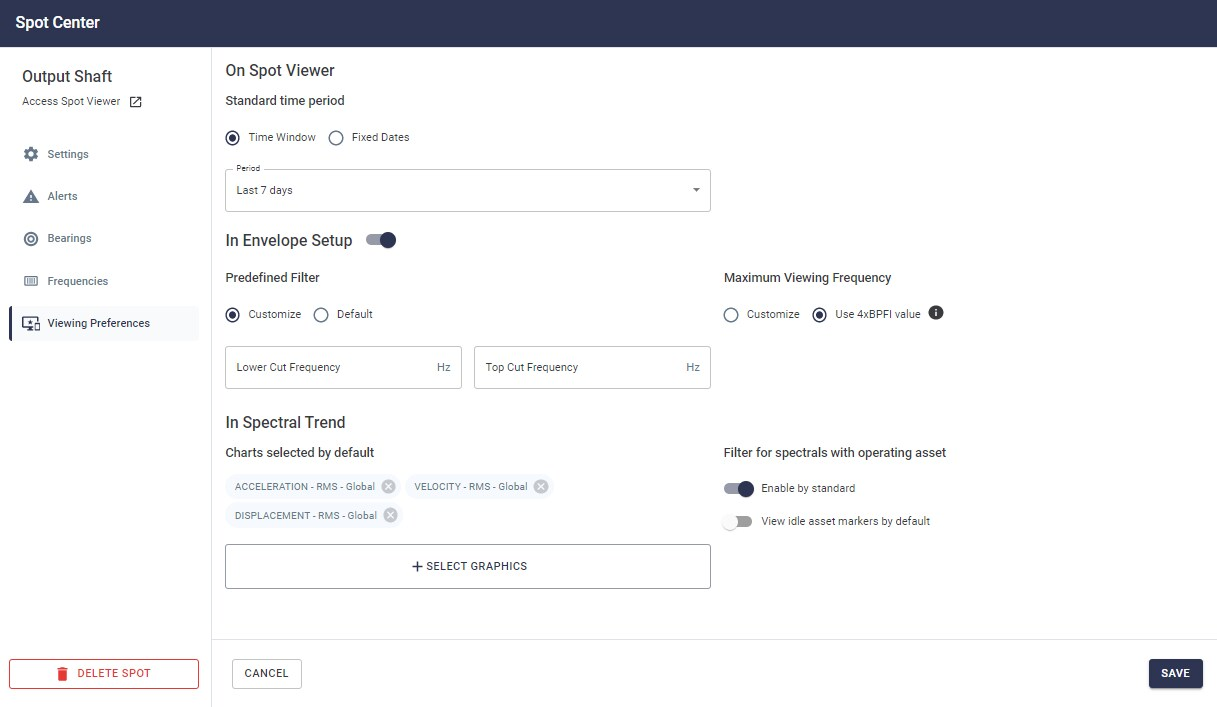
Figure: Viewing preference settings
Spot Viewer: On this screen you can pre-set the default time period displayed when the user accesses the Spot continuous data history. The functionality impacts the way information in other fields is displayed, such as the timeline, charts, events, and predictive analytics. You can select time ranges or even a fixed date.
Envelope Settings: in the Envelope Settings option it is possible to customize and define filters so that when the user selects the option in the spectrum analysis, it is already previously set as can be seen in the picture below. Likewise, it is also possible to define the maximum display frequency, whose value is customizable or even automatically defined by the Platform according to the main registered bearing model, taking into account the 4xBPFI reference (passage of rolling elements on the internal race) and the defined RPM.
Envelope Settings: in the Envelope Settings option it is possible to customize and define filters so that when the user selects the option in the spectrum analysis, it is already previously set as can be seen in the picture below. Likewise, it is also possible to define the maximum display frequency, whose value is customizable or even automatically defined by the Platform according to the main registered bearing model, taking into account the 4xBPFI reference (passage of rolling elements on the internal race) and the defined RPM.
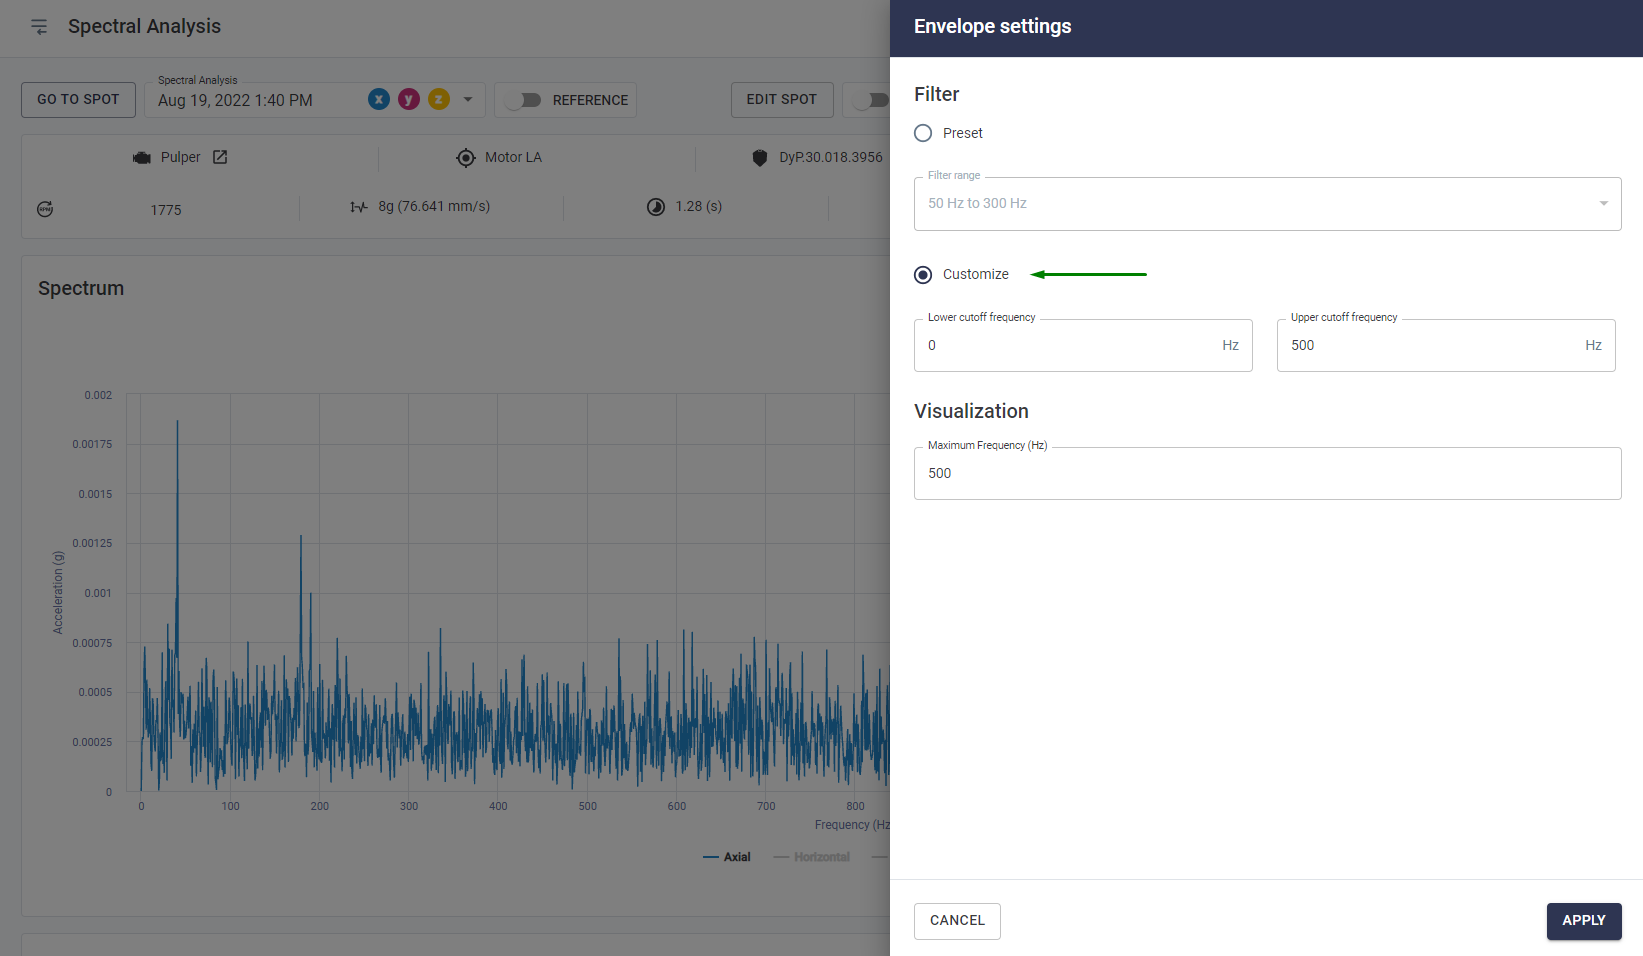
Figure: Envelope filter already customized based on viewing preferences
Spectral Trend: Similar to the Spot Viewer preferences, the Spectral Trend screen can be configured to define the standard graphs to be viewed by all users for that Spot. By default, the active graphs are always “RMS Acceleration – Global, RMS Velocity – Global and RMS Displacement – Global”. However, there are many other graphs available that may be even more useful in visualizing faults for the different types of assets monitored by Dynamox sensors.
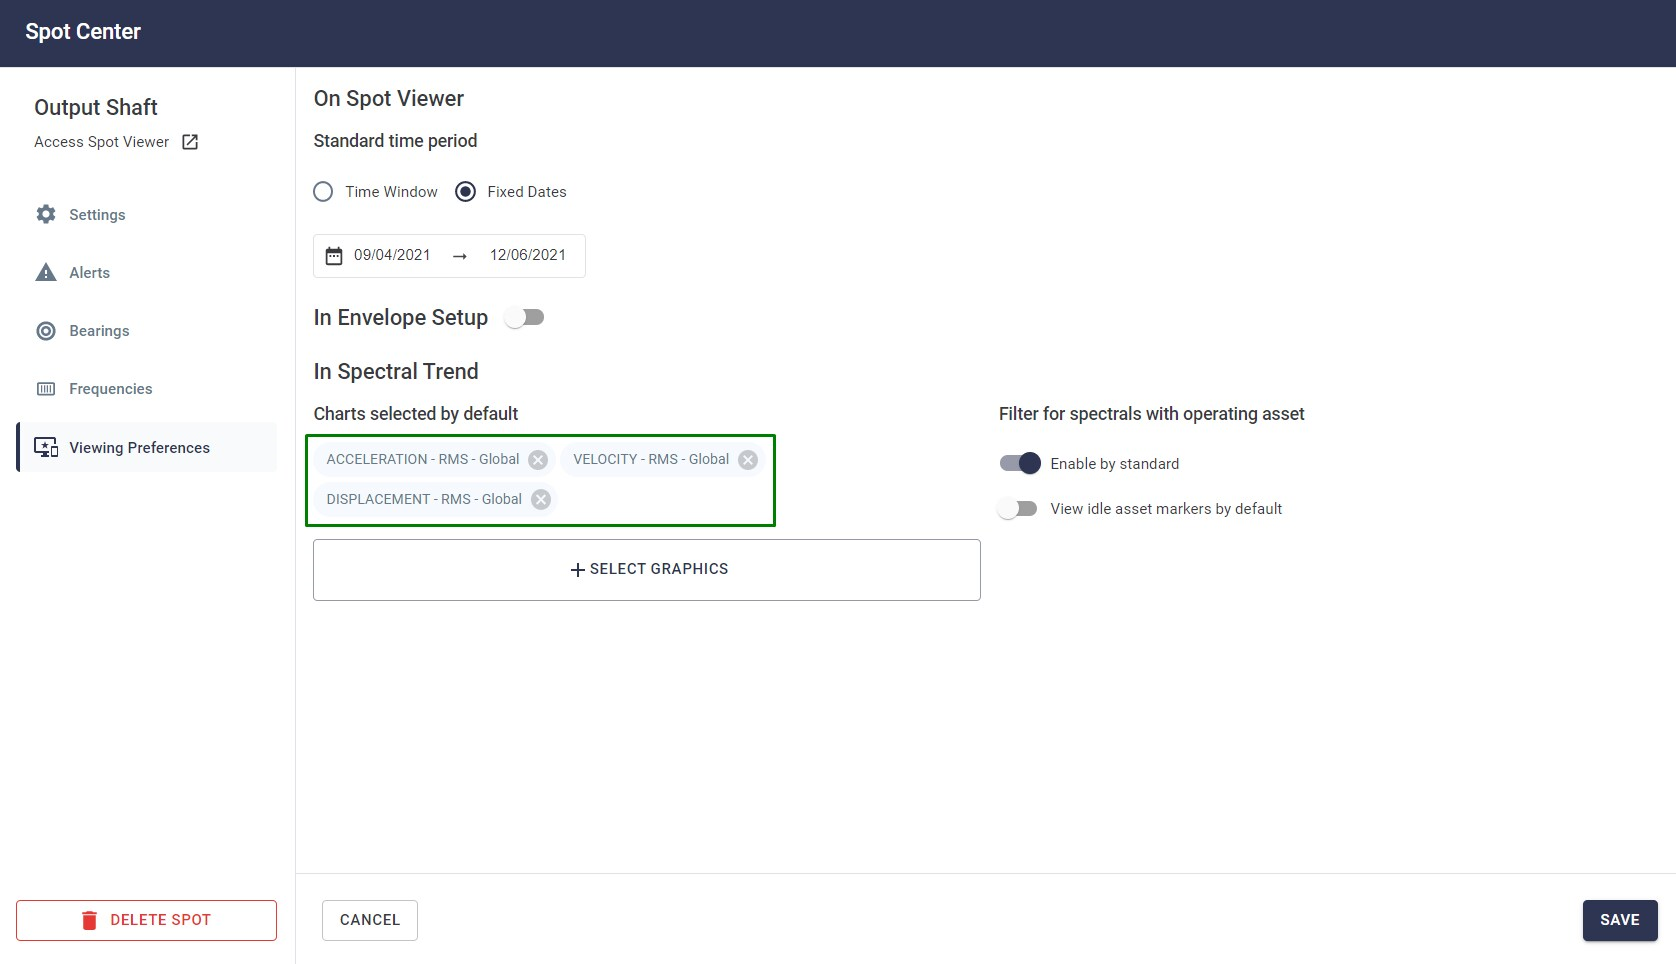
Figure: Spectral Trend Graph Viewing Preferences
To select other graph types, simply click on “ ” and a new screen with options will be shown:
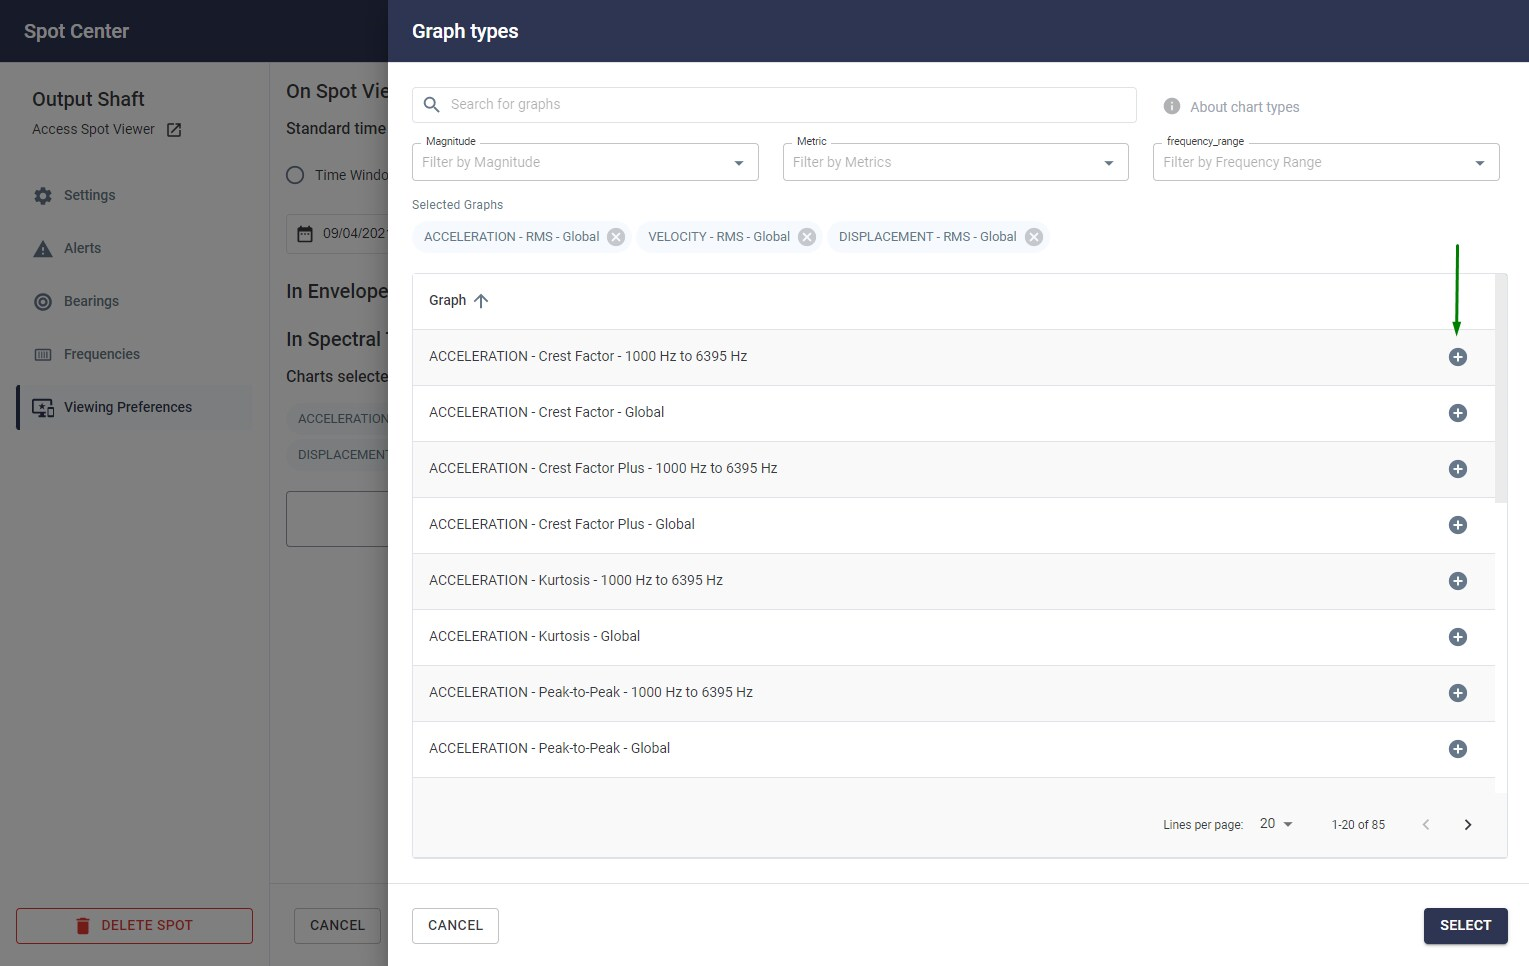
Figure: Spectral trend options
The graphs chosen in this viewing preference feature will be shown on the spectral trend screen, as per the example below.
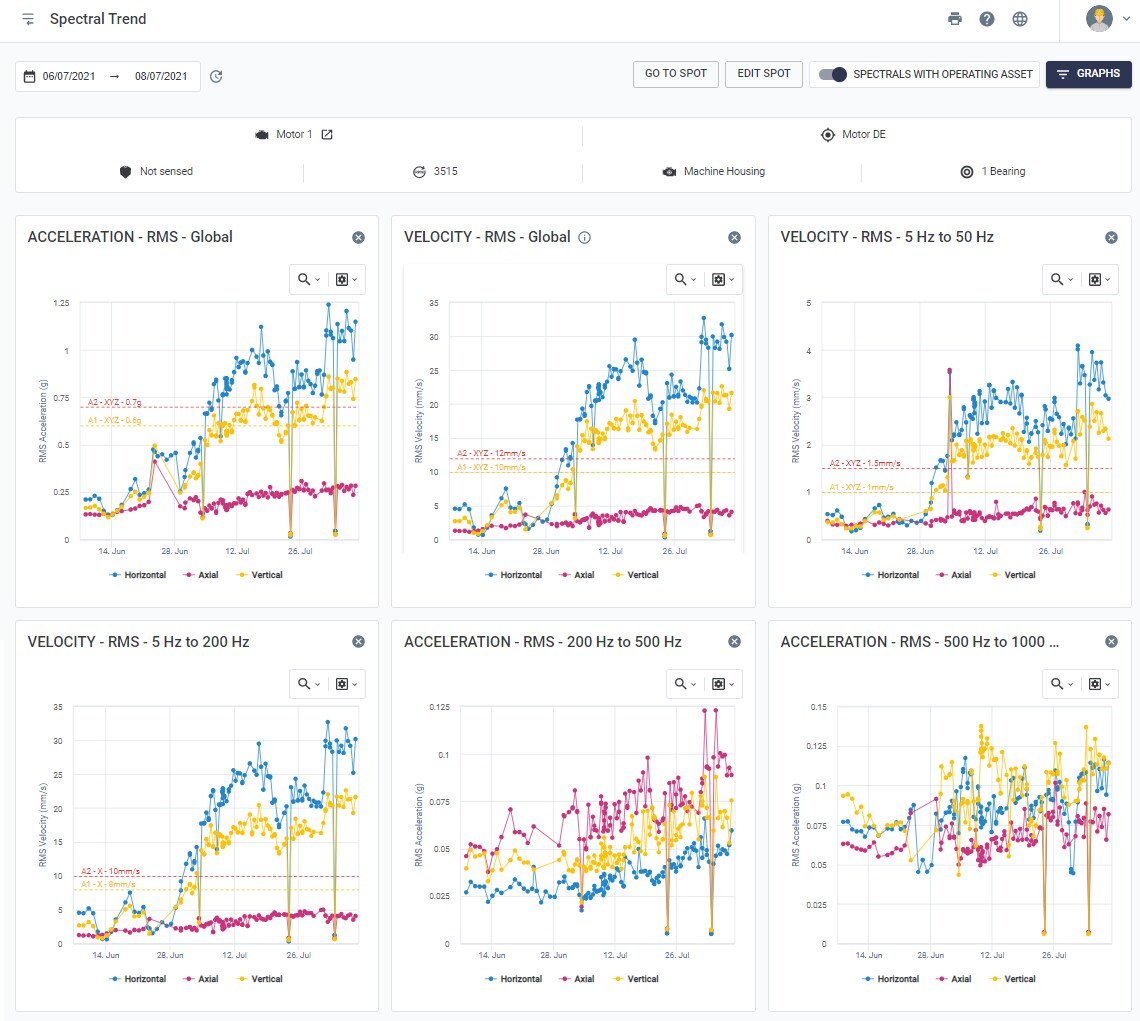
Figure: Spectral Trend with Saved Graphics via Viewing Preference.
Back to articles