Web Platform
3.1.2) Maximum Frequency, Duration and Resolution
Updated at 3/10/2023
In DynaLoggers, when requesting a vibration spectrum (via Gateway or App), it is possible to set the duration of the collection time made by the sensor on the waveform and it is also possible to choose the maximum frequency (max frequency).
The number of turns and the number of lines will change depending on the choices made in these parameters. The relationship of number of lines and collection duration (per frequency) for each DynaLogger model is shown below:
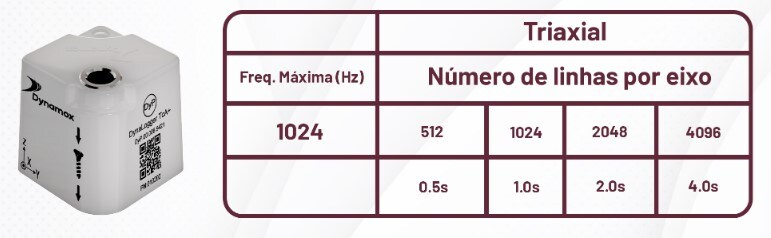
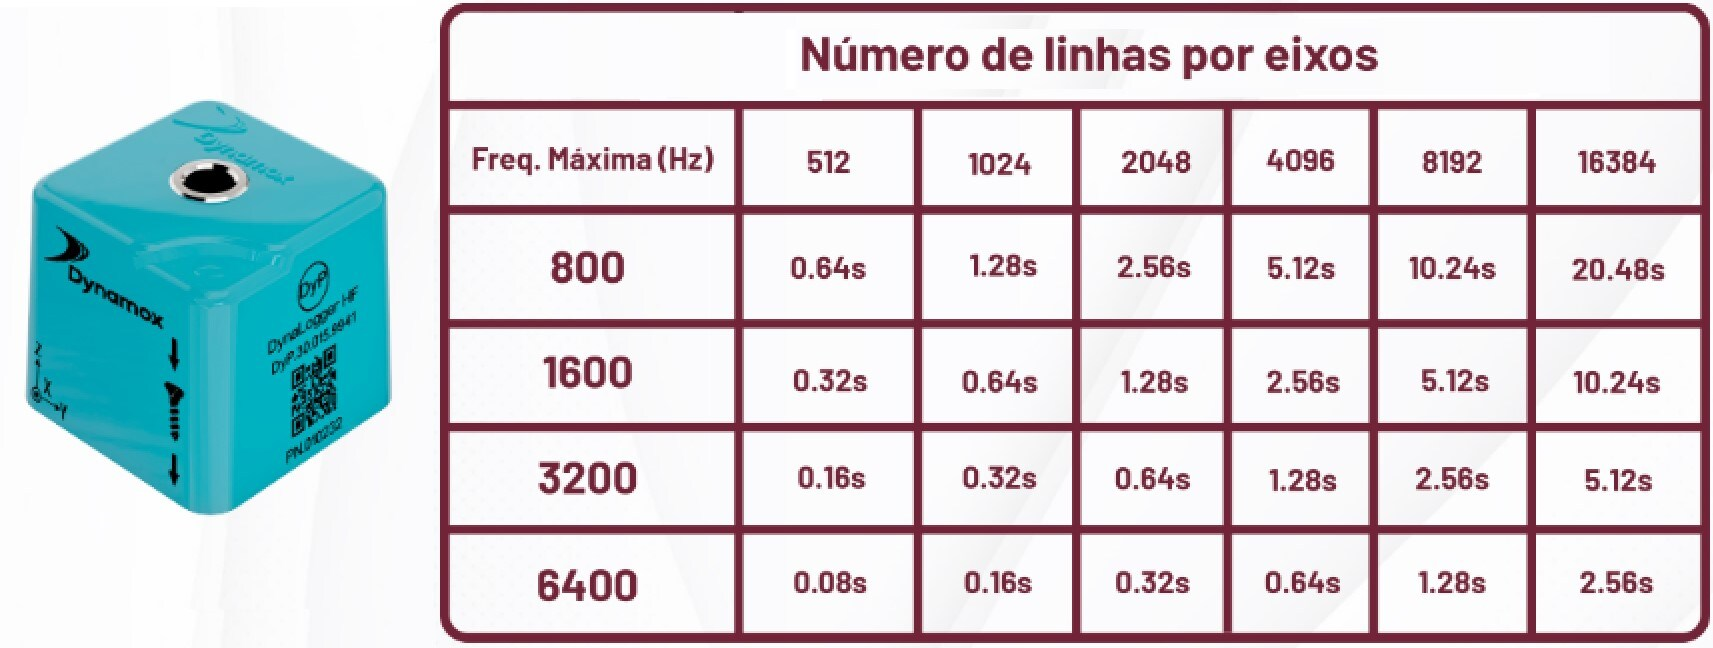
Figure: Settings for maximum frequency duration and respective number of lines. DynaLogger TcA+ above, DynaLogger HF below.
The collection duration reflects the signal acquisition in time (waveform). The maximum frequency chosen will be the data range converted to the frequency domain (Hz or CPM). This configuration can be done via the Dyna-Predict mobile application or via the Web Platform in the “Settings” tab, as shown in the following pictures.
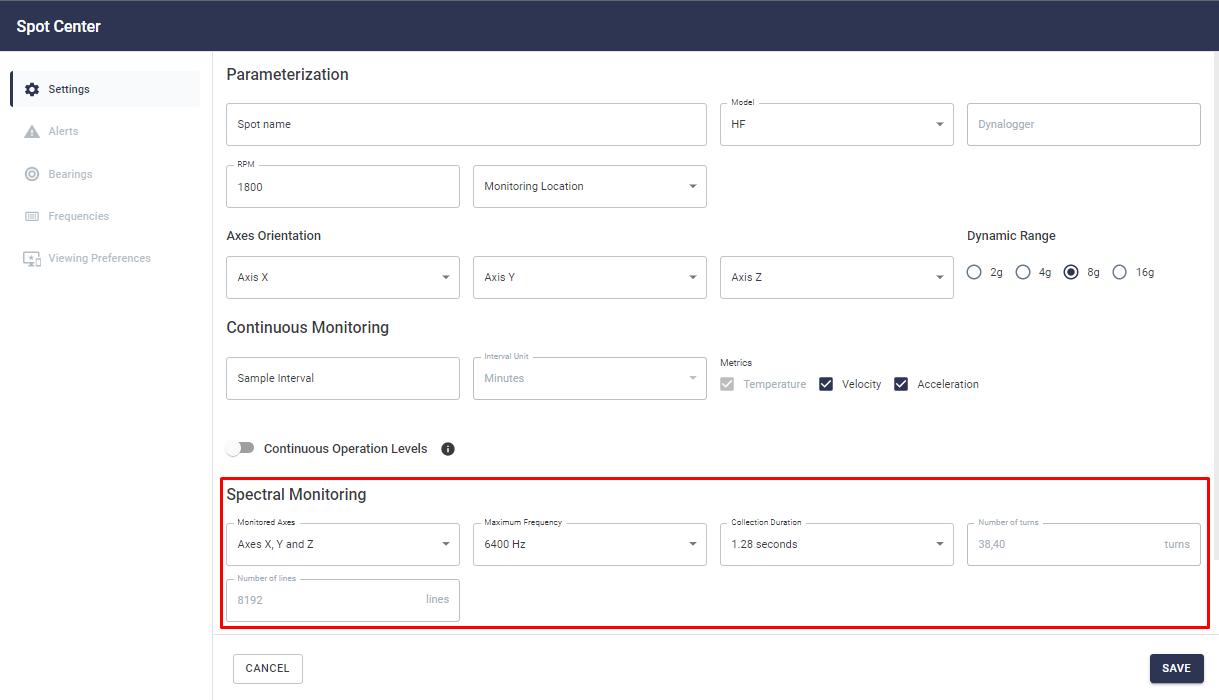
Figure: Web Platform Interface for Spectral Configuration
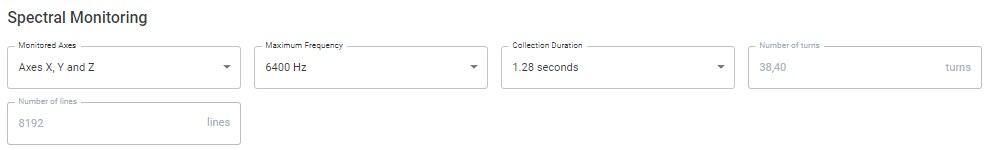
Figure: Spectral monitoring settings details
The user, when selecting the “collection duration” (Tcollection), is also changing the number of temporal samples that the sensor will collect, which is 2x the Number of lines (shown in the image of the sensor models). The expected number of lines for the spectra, using only the maximum frequency information and the collection duration is given by:
Both numbers (of samples and lines) affect the signal resolution, in waveform and vibration spectrum respectively. The spectral resolution can be calculated based on the maximum frequency or simply on the sampling duration
Example: suppose you choose a maximum frequency of 6400 Hz, with a duration of 2.56 seconds. The resolution in the spectrum will be:
Whereas if a duration of only 0.08 second is chosen. The resolution will be:
In summary, the spectrum resolution will be extremely impaired with such a low time duration, because the signal is collected with a lower level of detail.
Visual Examples
Case 1 – Short time of collection
In this case the DynaLogger TcA+ was used for measurement with a maximum acquisition frequency of 1024 Hz and collection time duration of 0.5 s. Using the equations above one can expect a resolution at the frequency of 2 Hz and expect to get around 512 lines in the spectrum.
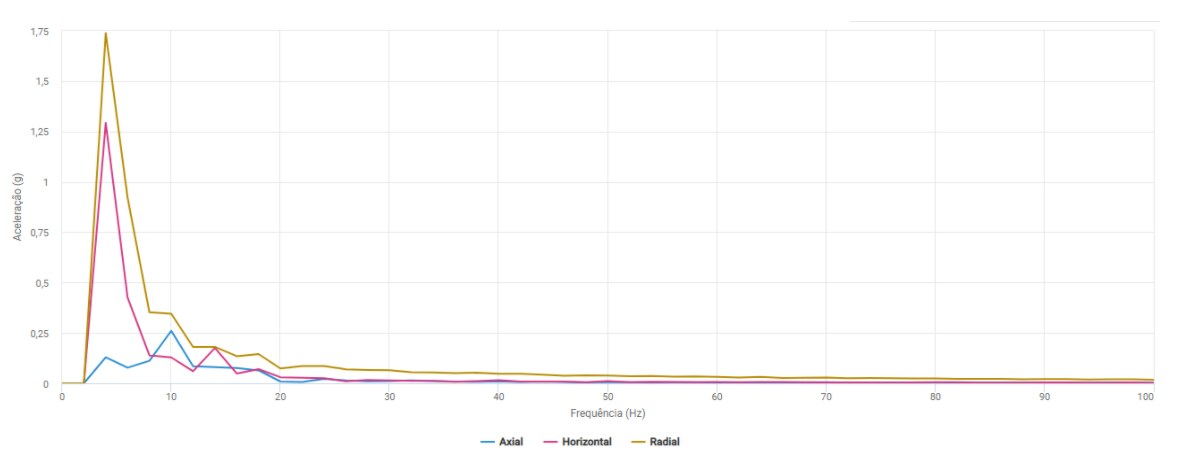
Figure: Vibration spectrum with 2 Hz resolution with zoom in the range 0 to 100 Hz.
As expected, the short duration of the collection time leads to low spectral resolution. It can be seen in the picture that the frequencies adjacent to the peak frequency have their amplitude recorded around this frequency, making the decay of the peak frequency slow, making analysis around the peak frequency difficult, or in some cases impossible.
Case 2 – Long collection time
For this case the DynaLogger TcA+ was used again for measurement at the same maximum frequency of 1024 Hz, however the collection duration was increased to 4 s. Using the equations again, one can expect a resolution at a frequency of 0.25 Hz and around 4096 lines in the spectrum, an 8-fold increase in the number of spectral lines compared to the previous case.
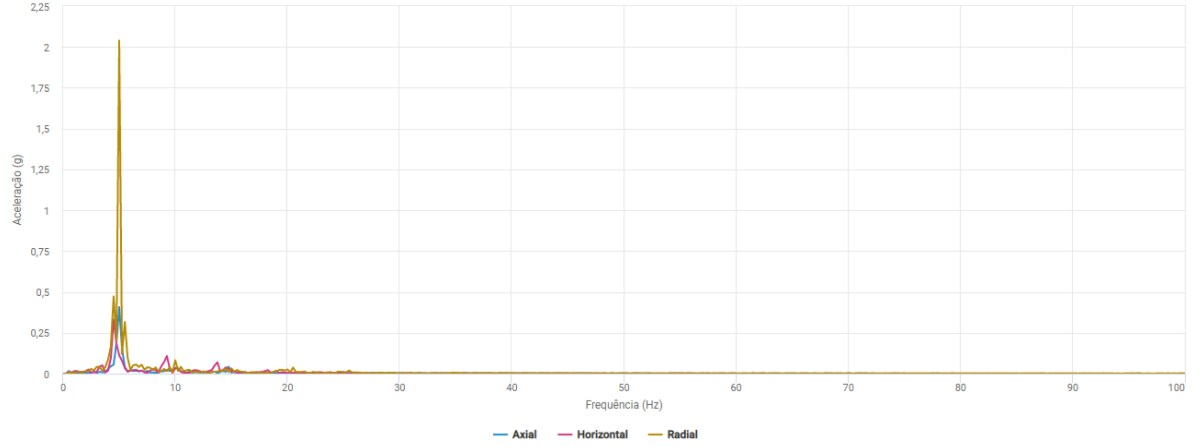
Figure: Vibration spectrum with 0.25 Hz resolution with zoom in the frequency range 0 to 100 Hz.
Comparing the cases it is noted that the acquisition done with a longer collection time duration allows a better definition of the peak frequency and that adjacent frequencies are better accounted for, which allows frequency analysis very close to the peak frequency.
It is worth noting that increasing the sample duration also leads to longer post-processing and data transfer time. However, whenever possible, the user should choose a longer collection time in order to increase their spectral discretization.
It is worth noting that increasing the sample duration also leads to longer post-processing and data transfer time. However, whenever possible, the user should choose a longer collection time in order to increase their spectral discretization.
Back to articles