Web Platform
3.1.1) How to choose de dynamic range
Updated at 3/13/2023
When setting up a spot, one of the settings to be made is the “Dynamic Range” setup.
The dynamic range is a parameter that delimits the maximum vibration level that can be measured by the DynaLogger sensor. There are 4 options: ±2g, ±4g, ±8g and ±16g, as shown in the Figure below.
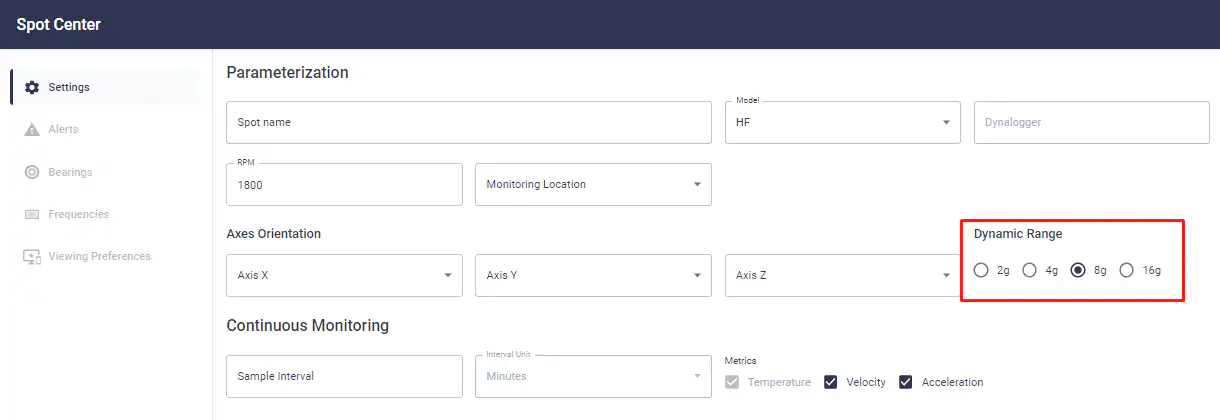
Figure: Dynamic range interface selection
If there is no previous knowledge of the vibration levels under normal operating conditions of the machinery or a history that helps in defining the dynamic range, the following procedure can be chosen:
1. At first you can set the dynamic range to a higher value, for example 8g, which is the system’s default setting.
2. Next, you should perform a spectral analysis of the machine in full operation.
3. The waveform (signal in time) should be analyzed, as it will help in the decision-making for correct definition of the dynamic range. Typical cases are dealt with below and come with a respective decision making to fit the dynamic range.
Case 1 – Saturated Measurement
In this case, the measurement taken will have amplitude values equal or greater than the selected dynamic range. The picture below shows a saturated measurement, where the chosen dynamic range was ±2g.
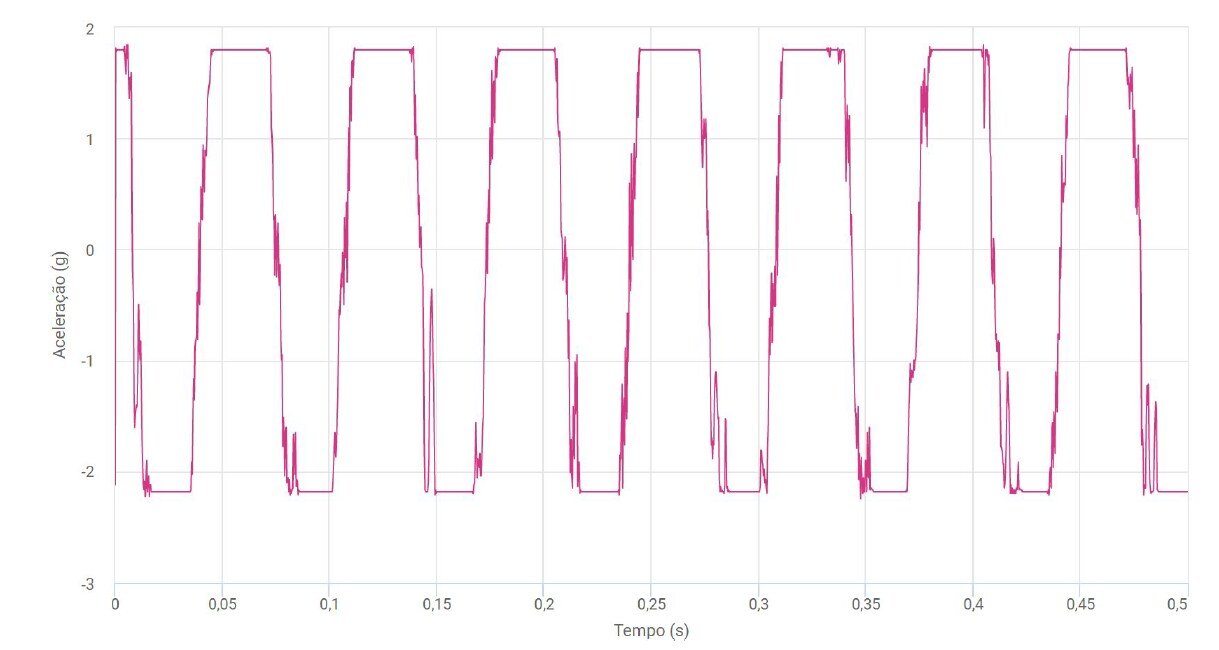
In this case you should increase the dynamic range to a higher value. When increasing the dynamic range it is necessary to take a new measurement, obtain a spectrum and check the waveform again. If the levels are within the new dynamic range with a certain amplitude margin, this range can be admitted.
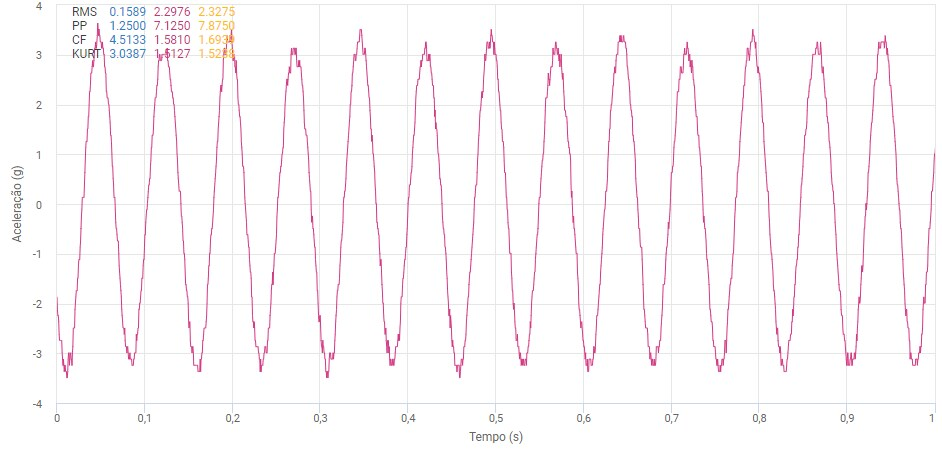
Case 2 – Unsaturated measurement, but with low margin
In this case the amplitude of the measurement is within the dynamic range, but the captured amplitude values are very close to the set value. If the machinery develops a problem, it is likely that the vibration levels will tend to increase and may exceed the set dynamic range, again saturating the measurement (see case 1). In this case it is only recommended that the user increases the dynamic range to the next level, so that the vibration evolution of the machinery can be observed without saturation.
The Figure below shows the case of an unsaturated measurement, but with low margin. It was ±4g.
Case 3 – Unsaturated measurement with margin (ideal case)
In this type of measurement, the amplitude levels collected are within the selected dynamic range and still have room for increase. This is the case where the dynamic range is ideal for monitoring machinery. The picture below shows the case of a correctly chosen dynamic range of the sensor.
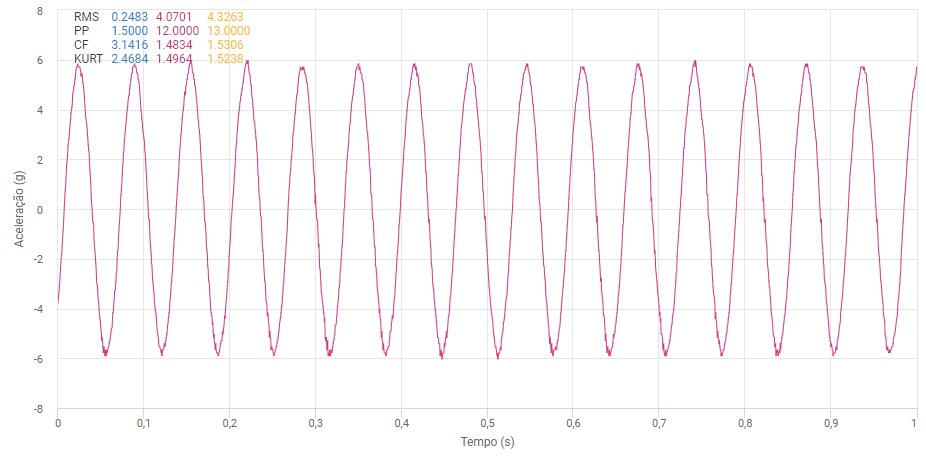
Case 4 – Unsaturated measurement, but with a lot of margin
A common mistake is to select a too high dynamic range, i.e. with too much margin between the actual vibration amplitudes of the asset and the dynamic range limit. This type of setting allows the monitoring of the machine without any saturation, however it loses in terms of resolution (signal quality). The dynamic range options available and their respective resolutions are presented in the following table.
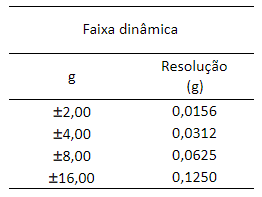
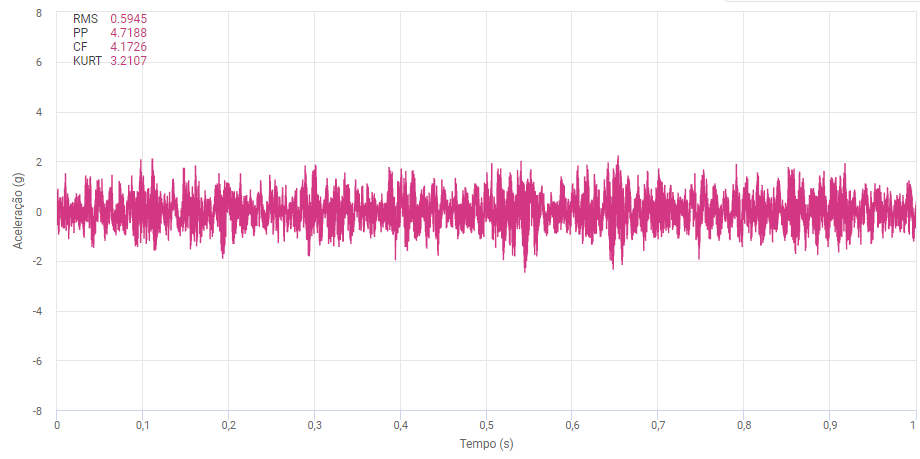
Figure: Unsaturated measurement with too much margin: dynamic range chosen of ±8g and measured waveform with levels equal or smaller than approximately ±2.5g. Suggestion: Change to ±4 g
Back to articles