Web Platform
11.3) Machine Viewer
Updated at 3/3/2023
The Machine Viewer is a tool for viewing information about the company’s machines, joining information from the sensitive and predictive modules. There are two ways to access the functionality: through the side menu, in the “Machines” option, or by clicking on the desired machine through the asset tree. This screen encompasses all information relating to a particular machine in the plant, grouping Subassemblies, Components and Spots common to it.
Applicable information and filters
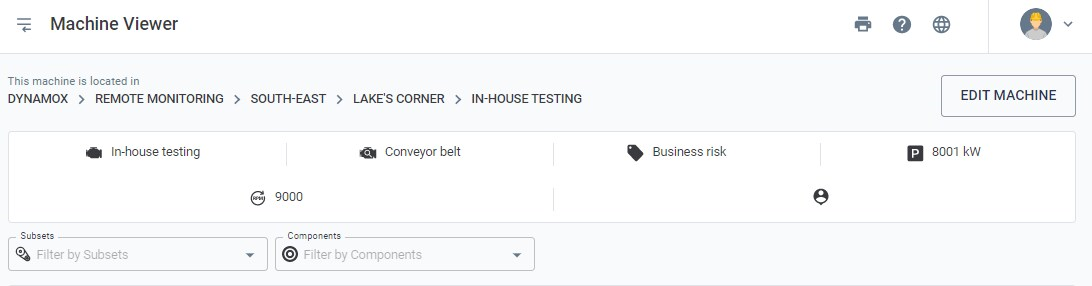
The top of the Machine Viewer shows the path within the asset tree where this machine is located, a table with machine information, and filters for Subsets and Components. If any of these filters are applied, the information shown in the rest of the screen will refer only to the filtered items. In addition, you must define the starting instant and the number of revolutions displayed in the graph.
Timeline
Just below the filter options, a timeline is displayed with the events of all the monitoring points registered on the machine, such as Spots creation/deletion, Spots parameterization, spectral analysis, A2 alerts triggered, checklists performed, and reports issued. By default the events of the last seven days will be shown, but this interval can be changed through the calendar in the upper left corner.
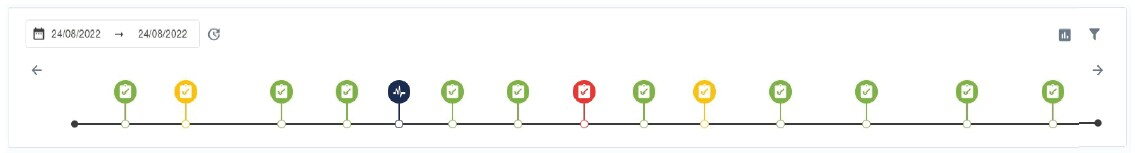
Picture: Machine’s timeline.
It is worth noting that the events presented in the machine timeline are for the time period selected above. In the same way presented in the Spot Viewer, one can comment on each event individually, generating a history of conversation between users
Monitoring Points
Below the timeline, in the Machine Viewer, a reduced version of the DMA is shown, with only the Spots referring to that machine (or subsets/components, if a filter is applied). The information follows the same pattern as that displayed in the traditional DMA.
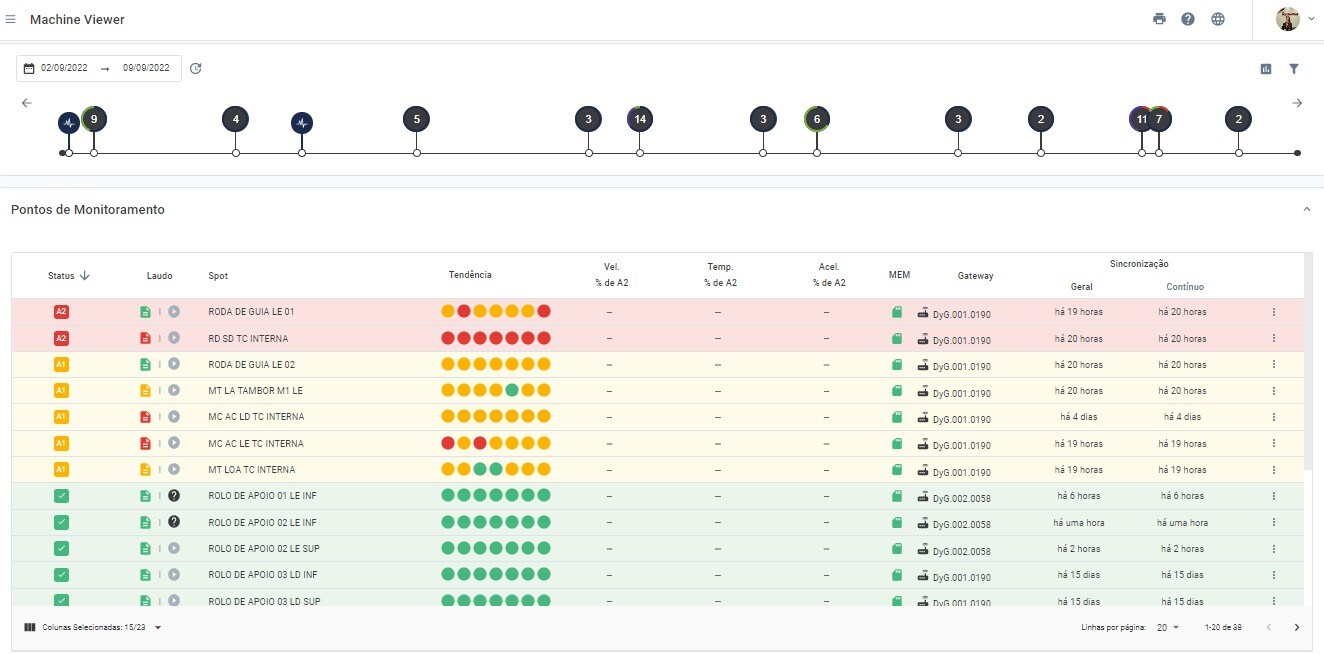
Figure: Reduced version of the DMA Dashboard on the machine screen
Anomalies – Sensitive Module
The “Anomalies” field lists all the anomalies reported by users in the checklists’s answers filled out during the sensitive module routes, for the customers who have purchased it. Listed in this section are: the anomalies, observations, user responsible, subset/component, and date/time. By clicking on one of these anomalies, the user is redirected to the checklist report.
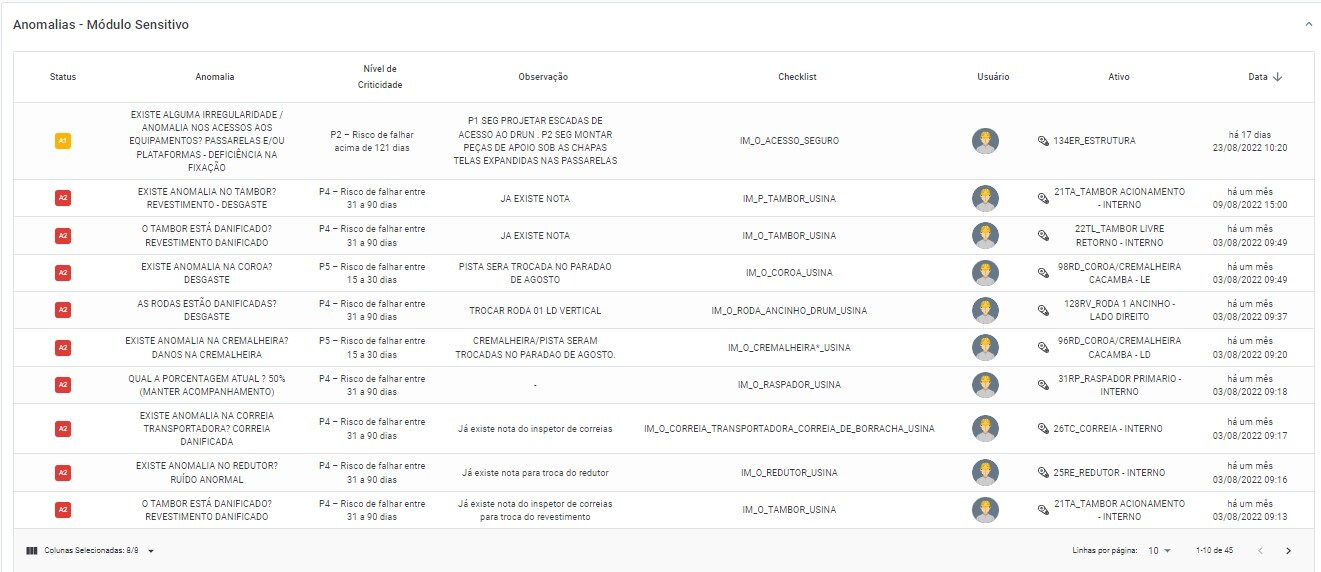
Picture: Anomalies – Sensitive Module
As in the other features on this screen of the Platform, the information displayed follows the pattern according to the time period chosen on the machine timeline.
Manual Measurements
Also belonging to the sensitive module, below the “Anomalies” field, a graph is displayed with the results of the manual measurements performed on the routes of the sensitive module. To select which magnitudes will be displayed in the graph, simply click on the “
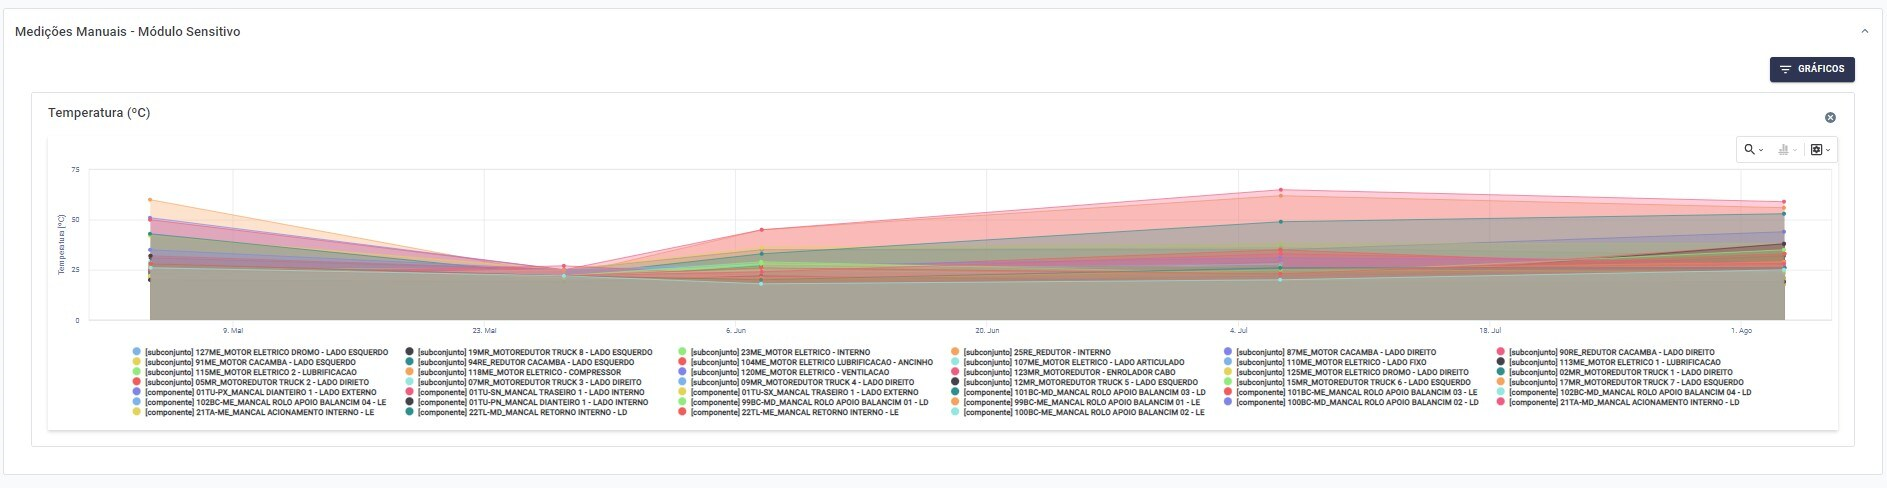
Picture: Manual Measurement Graphs – Sensitive Module
The Sensitive Module is a tool in the DynaPredict solution for managing inspection routes on field. For more information about the usability of the solution, please see the Sensitive Inspection Manual.
Predictive Analysis
At the bottom of the page is the “Predictive Analysis” section, referring to the performance of technical reports from multiple monitoring points on the machine. All reports performed in the period are presented.
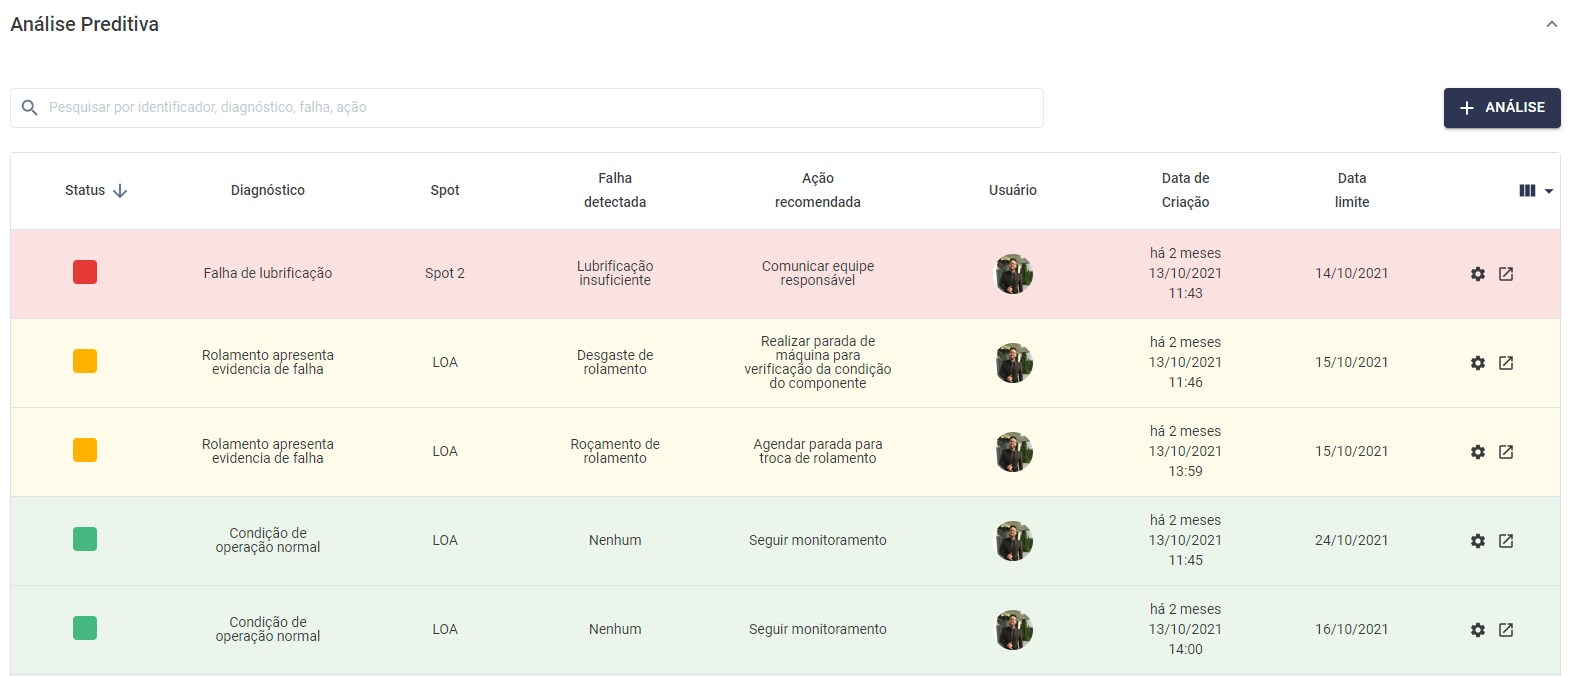
Figure: Predictive Analyses performed on the machine, per monitoring point
To make new reports, the user simply selects the icon “
Back to articles