Web Platform
11.1) Health Indicators
Updated at 3/3/2023
The Health Indicators, within the Integrated Dashboard, display the health indices of different plants or work areas of the company. Each is represented by a pie chart indicating the health of the assets in the area, based on the number of Spots and inspection routes that triggered A1 or A2 alerts.
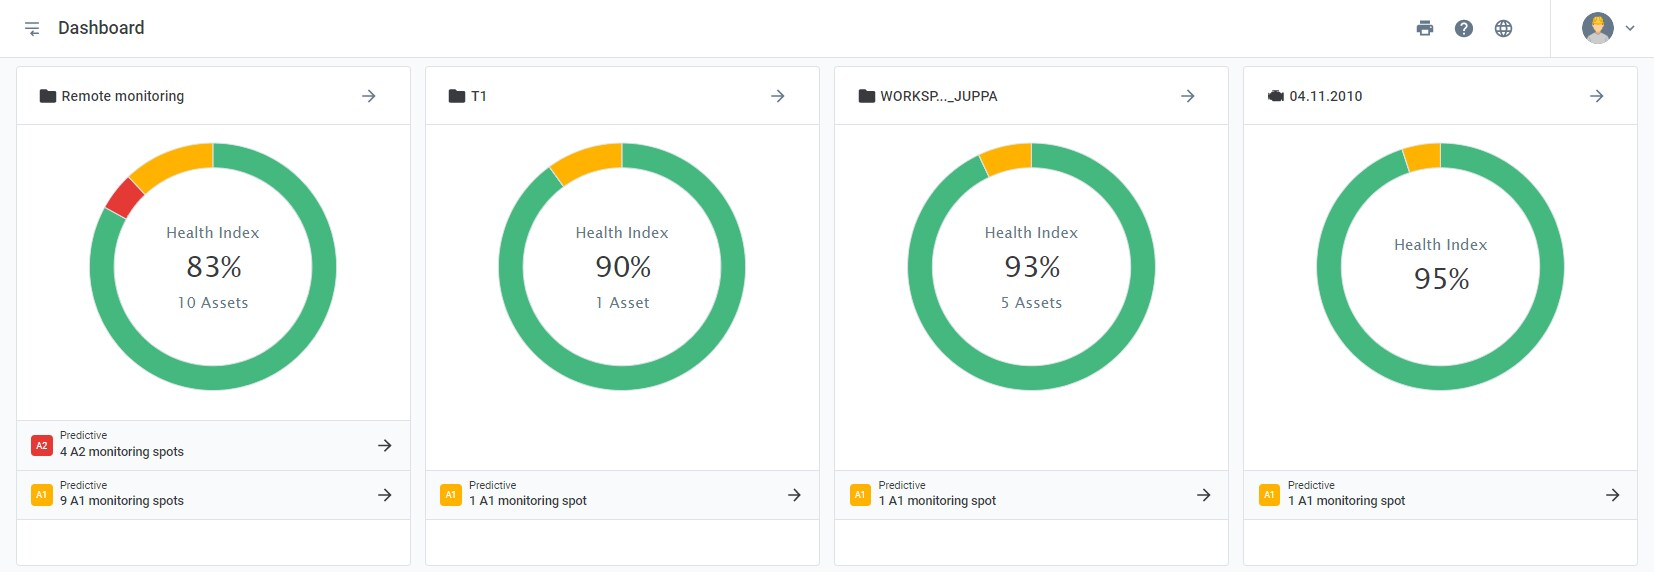
Picture: Health indices by sectors or plants
In this same screen, you can click on the side arrows in each pie chart so that, within the organization of the asset tree, a new Dashboard is generated with the sublevels and machines related to the selected one. In this way, it is possible to perform an integrated and specific visualization of all areas and sub-areas of the plant.
The purpose of this screen is to show which areas need more attention from the maintenance or reliability team, i.e., which of them are theoretically in more compromised health and are impacting the overall health levels.
Back to articles