Mobile App
3.3) Vibration spectra
Updated at 3/3/2023
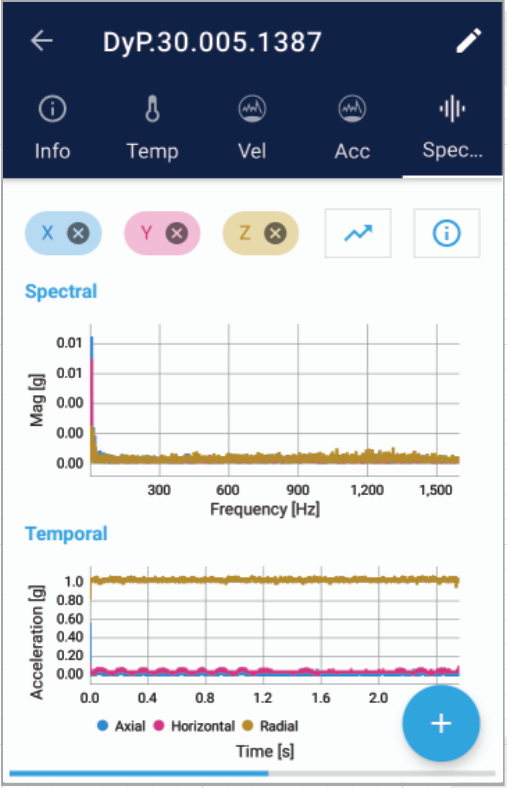
Spectral Analysis
The “Spectral” tab, allows the user to request a spectral analysis from the DynaLogger. This analysis can be performed on a specific axis or on all three axes simultaneously, by simply pressing the icon (+).
The user will be asked to select the axis (X, Y, Z or all) on which to perform the spectral analysis. On the HF and AS devices, the user will also be asked for the duration and maximum frequency of the spectral analysis.
After the spectral analysis, two graphs will be displayed: one with accumulated time and the other with the frequency spectrum. In addition to acceleration graphs, it is also possible to view velocity graphs.
To do this, simply touch the selection button (above the charts) and select the desired graphic. It is also possible to show or hide the axes to be viewed and access details of the spectral analysis.
By synchronizating the app, the data will be sent to the Web Platform, where the user can analyze the data in more detail.
Back to articles