Mobile App
3.1) Data collection and instantaneous readings
Updated at 3/3/2023
By selecting a specific machine on the home screen of the app, the list of spots associated to that machine will be displayed. When selecting a spot from the Spot List, the app will attempt to connect to the associated DynaLogger, downloading the data from the device’s internal memory if it is within Bluetooth range (60m in open field).
If no machine or spot appears, visit the sections for creating machines and/or spots.
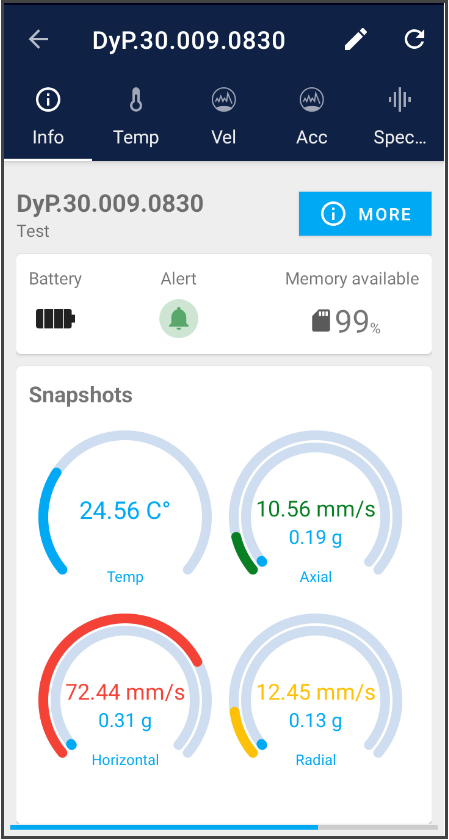
Snapshots – Instant Reading
The first screen the user will have access to is the “Instant Reading” where temperature and vibration values are shown in the 3 axes in real time. The default fill of these graphs is blue. However, for parameters with thresholds defined in the spot configurations, the color of the graph will change if the limits are exceeded. If no limit is exceeded, the graph color is green. If the A1 limit is exceeded, the graph color will change to yellow. If the A2 limit is exceeded, the color will change to red.
There is also information about the battery life, alert level and available memory on the device. Additional information can also be accessed from the associated DynaLogger, such as serial number, sample interval, and more.
Back to articles